
Page 126 - Instant notes
P. 126
Physical chemistry 112
Each of these lines shows a decrease with increasing mole fraction of the solutes, B
and A, from the freezing temperatures of the pure solids, and , when x A is near
unity and zero respectively. At the mole fraction x eu, and temperature T eu, the two lines
meet. This point is called the eutectic point, and this
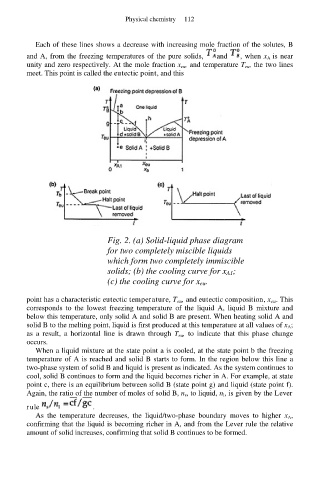
Fig. 2. (a) Solid-liquid phase diagram
for two completely miscible liquids
which form two completely immiscible
solids; (b) the cooling curve for x A1;
(c) the cooling curve for x eu.
point has a characteristic eutectic temperature, T eu, and eutectic composition, x eu. This
corresponds to the lowest freezing temperature of the liquid A, liquid B mixture and
below this temperature, only solid A and solid B are present. When heating solid A and
solid B to the melting point, liquid is first produced at this temperature at all values of x A;
as a result, a horizontal line is drawn through T eu, to indicate that this phase change
occurs.
When a liquid mixture at the state point a is cooled, at the state point b the freezing
temperature of A is reached and solid B starts to form. In the region below this line a
two-phase system of solid B and liquid is present as indicated. As the system continues to
cool, solid B continues to form and the liquid becomes richer in A. For example, at state
point c, there is an equilibrium between solid B (state point g) and liquid (state point f).
Again, the ratio of the number of moles of solid B, n s, to liquid, n l, is given by the Lever
rule .
As the temperature decreases, the liquid/two-phase boundary moves to higher x A,
confirming that the liquid is becoming richer in A, and from the Lever rule the relative
amount of solid increases, confirming that solid B continues to be formed.