
Page 128 - Instant notes
P. 128
Physical chemistry 114
constructed. This method is convenient and general, as the rules that govern the
appearance of break and halt points apply to all phases and phase transitions.
Liquid-vapor phase diagrams
When a completely miscible liquid mixture that is also an ideal solution (see Topic D1)
is heated until it vaporizes, a liquid-vapor phase diagram can be constructed. For all
mixtures, the boiling points of pure A and pure B will be different. If the boiling point of
pure A is greater than that of pure B, at any composition, more B will be in the vapor
phase than A. Both vapor composition and liquid composition lines are drawn, leading to
a phase diagram with information concerning the compositions of both liquid and vapor
(Fig. 3).
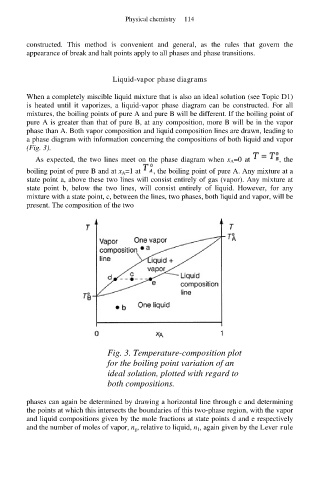
As expected, the two lines meet on the phase diagram when x A=0 at , the
boiling point of pure B and at x A=1 at , the boiling point of pure A. Any mixture at a
state point a, above these two lines will consist entirely of gas (vapor). Any mixture at
state point b, below the two lines, will consist entirely of liquid. However, for any
mixture with a state point, c, between the lines, two phases, both liquid and vapor, will be
present. The composition of the two
Fig. 3. Temperature-composition plot
for the boiling point variation of an
ideal solution, plotted with regard to
both compositions.
phases can again be determined by drawing a horizontal line through c and determining
the points at which this intersects the boundaries of this two-phase region, with the vapor
and liquid compositions given by the mole fractions at state points d and e respectively
and the number of moles of vapor, n g, relative to liquid, n 1, again given by the Lever rule