
Page 358 - Instrumentation Reference Book 3E
P. 358
References 341
-
R
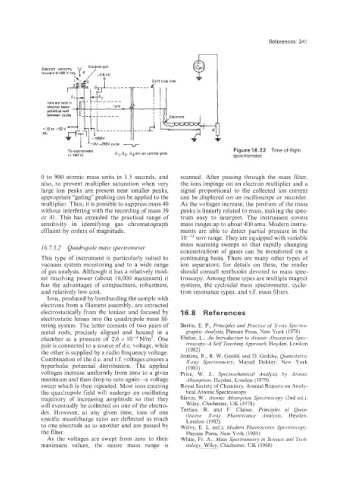
To electrometer GI, Gz, G3 are ion control grids Figure 16.22 Time-of-flight
I+15OV) spectrometer.
0 to 900 atomic mass units in 1.5 seconds, and scanned. After passing through the mass filter,
also; to prevent multiplier saturation when very the ions impinge on an electron multiplier and a
large ion peaks are present near smaller peaks, signal proportional to the collected i ion current
appropriate “gating” peaking can be applied to the can be displayed on an oscilloscope or recorder.
multiplier. Thus, it is possible to suppress mass 40 As the voltages increase, the position of the mass
without interfering with the recording of mass 39 peaks is linearly related to mass, making the spec-
or 41. This has extended the practical range of trum easy to interpret. The instrument covers
sensitivity in identifying gas chromatograph mass ranges up to about 400 amu. Modern instru-
effluent by orders of magnitude. ments are able to detect partial pressure in the
torr range. They are equipped with variable
16.7.5.2 Quadrupole mass spectrometer mass scanning sweeps so that rapidly changing
concentrations of gases can be monitored on a
This type of instrument is particularly suited to continuing basis. There are many other types of
vacuum system monitoring and to a wide range ion separators; for details on these, the reader
of gas analysis. Although it has a relatively mod- should consult textbooks devoted to mass spec-
est resolving power (about 16,000 maximum) it troscopy. Among these types are multiple magnet
has the advantages of compactness, robustness, systems, the cycloidal mass spectrometer, cyclo-
and relatively low cost. tron resonance types, and r.f. mass filters.
Ions, produced by bombarding the sample with
electrons from a filament assembly, are extracted
electrostatically from the ionizer and focused by 16.8 References
electrostatic lenses into the quadrupole mass fil-
tering system. The Batter consists of two pairs of Berth, E. P., Principles and Practice of X-ray Spectro-
metal rods, precisely aligned and housed in a graphic Analysis, Plenum Press, New York (1970)
chamber at a pressure of 2.6 x 10⁻⁴N/m2. One Ebdon, L., An Introduction to Atomic Absorption Spec-
pair is connected to a source of d.c. voltage, while troscopy-A Self Teaching Approach, Heyden. London
the other is supplied by a radio frequency voltage. (1982)
Combination of the d.c. and r.f. voltages creates a Jenkins, R., R. W. Gould, and D. Gedcke, Quantirutiiv
X-ray Spectuornetry, Marcel Dekker, New York
hyperbolic potential distribution. The applied (1981)
voltages inlcrease uniformly from zero to a given Price, W. J., Spectrocheniical Analysis by Atomic
maximum and then drop to zero again-a voltage Absorption, Heyden, London (1979)
sweep which is then repeated. Most ions entering Royal Society of Chemistry, Annual Reports on Analy-
the quadrupole field will undergo an oscillating tical Atomic Spectroscopy
trajectory of increasing amplitude so that they Slavin, W., Atomic Absorption Spectroscopy (2nd ed.).
will eventually be collected on one of the electro- Wiley, Chichester, UK (1978)
des. However, at any given time, ions of one Tertian, R. and F. Claisse, Principles of’ Quan-
titative X-ray Fluorescence Analysis, Heyden,
specific masskharge ratio are deflected as much London (1982)
to one electrode as to another and are passed by Welvy. E. L. (ed.), Modern Fluorescence Spectroscop],.
the filter. Plenum Press, New York (1981)
As the voltages are swept from zero to their White, Fr. A.; Mass Spectrometry in Science and Tech-
maximum values, the entire mass range is nology, Wiley, Chichester, UK (1968)