
Page 357 - Instrumentation Reference Book 3E
P. 357
340 Chemical analysis: spectroscopy
Runyenos.=?357? 7 667 5?3z6367 7 722267 67 57
I
4
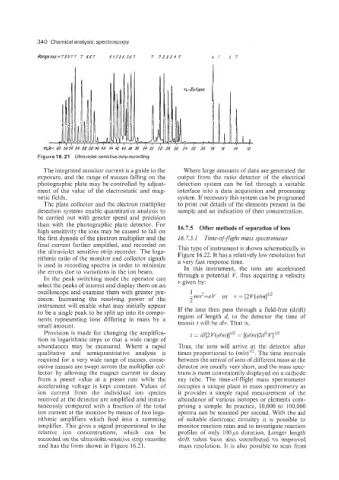
Figure 16.21 Ultraviolet-sensitive strip recording.
The integrated monitor current is a guide to the Where large amounts of data are generated the
exposure, and the range of masses falling on the output from the ratio detector of the electrical
photographic plate may be controlled by adjust- detection system can be fed through a suitable
ment of the value of the electrostatic and mag- interface into a data acquisition and processing
netic fields. system. If necessary this system can be programed
The plate collector and the electron multiplier to print out details of the elements present in the
detection systems enable quantitative analysis to sample and an indication of their concentration.
be carried out with greater speed and precision
than with the photographic plate detector. For 16.7.5 Other methods of separation of ions
high sensitivity the ions may be caused to fall on
the first dynode of the electron multiplier and the 16.7.5.1 Time-ofiflight mass spectrometer
final current further amplified, and recorded on This type of instrument is shown schematically in
the ultraviolet sensitive strip recorder. The loga-
rithmic ratio of the monitor and collector signals Figure 16.22. It has a relatively low resolution but
a very fast response time.
is used in recording spectra in order to minimize
In this instrument, the ions are accelerated
the errors due to variations in the ion beam. through a potential V, thus acquiring a velocity
In the peak switching mode the operator can
select the peaks of interest and display them on an v given by:
oscilloscope and examine them with greater pre- 1
cision. Increasing the resolving power of the -mv2=eV or v = [2~(e/m]’/*
2
instrument will enable what may initially appear
to be a single peak to be split up into its compo- If the ions then pass through a field-free (drift)
nents representing ions differing in mass by a region of length d, to the detector the time of
small amount. transit t will be dlv. That is,
Provision is made for changing the amplifica-
=
tion in logarithmic steps so that a wide range of t = d/[2 ~(e/rn)l”~ [(e/rn)2d2 u1I2
abundances may be measured. Where a rapid Thus, the ions will arrive at the detector after
qualitative and semiquantitative analysis is times proportional to (m/e)1/2. The time intervals
required for a very wide range of masses, conse- between the arrival of ions of different mass at the
cutive masses are swept across the multiplier col- detector are usually very short, and the mass spec-
lector by allowing the magnet current to decay trum is most conveniently displayed on a cathode
from a preset value at a preset rate while the ray tube. The time-of-flight mass spectrometer
accelerating voltage is kept constant. Values of occupies a unique place in mass spectrometry as
ion current from the individual ion species it provides a simple rapid measurement of the
received at the detector are amplified and instan- abundance of various isotopes or elements com-
taneously compared with a fraction of the total prising a sample. In practice, 10,000 to 100,000
ion current at the monitor by means of two loga- spectra can be scanned per second. With the aid
rithmic amplifiers which feed into a summing of suitable electronic circuitry it is possible to
amplifier. This gives a signal proportional to the monitor reaction rates and to investigate reaction
relative ion concentrations, which can be profiles of only 100ps duration. Longer length
recorded on the ultraviolet-sensitive strip recorder drift tubes have also contributed to improved
and has the form shown in Figure 16.21. mass resolution. It is also possible to scan from