
Page 58 -
P. 58
40 CHAPTER 2 Introduction to Enterprise Systems
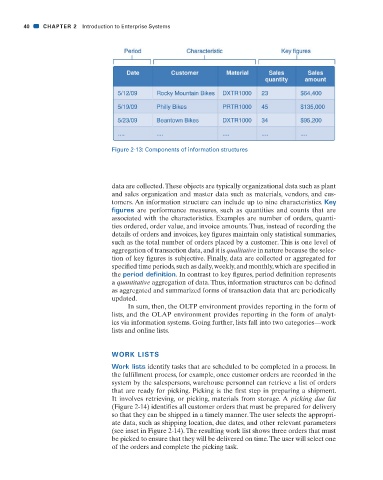
Figure 2-13: Components of information structures
data are collected. These objects are typically organizational data such as plant
and sales organization and master data such as materials, vendors, and cus-
tomers. An information structure can include up to nine characteristics. Key
figures are performance measures, such as quantities and counts that are
associated with the characteristics. Examples are number of orders, quanti-
ties ordered, order value, and invoice amounts. Thus, instead of recording the
details of orders and invoices, key fi gures maintain only statistical summaries,
such as the total number of orders placed by a customer. This is one level of
aggregation of transaction data, and it is qualitative in nature because the selec-
tion of key fi gures is subjective. Finally, data are collected or aggregated for
specifi ed time periods, such as daily, weekly, and monthly, which are specifi ed in
the period definition. In contrast to key fi gures, period defi nition represents
a quantitative aggregation of data. Thus, information structures can be defi ned
as aggregated and summarized forms of transaction data that are periodically
updated.
In sum, then, the OLTP environment provides reporting in the form of
lists, and the OLAP environment provides reporting in the form of analyt-
ics via information systems. Going further, lists fall into two categories—work
lists and online lists.
WORK LISTS
Work lists identify tasks that are scheduled to be completed in a process. In
the fulfi llment process, for example, once customer orders are recorded in the
system by the salespersons, warehouse personnel can retrieve a list of orders
that are ready for picking. Picking is the fi rst step in preparing a shipment.
It involves retrieving, or picking, materials from storage. A picking due list
(Figure 2-14) identifi es all customer orders that must be prepared for delivery
so that they can be shipped in a timely manner. The user selects the appropri-
ate data, such as shipping location, due dates, and other relevant parameters
(see inset in Figure 2-14). The resulting work list shows three orders that must
be picked to ensure that they will be delivered on time. The user will select one
of the orders and complete the picking task.
31/01/11 1:08 PM
CH002.indd 40
CH002.indd 40 31/01/11 1:08 PM