
Page 116 - Materials Chemistry, Second Edition
P. 116
L1644_C03.fm Page 91 Tuesday, October 21, 2003 3:11 PM
CFC Ozone layer depl.
Pb
Heavy metals Fatalities
Cd
Carcinogenics
PAH
Summer smog
Dust Subjective
Health Eco-Indicator
VOC Winter smog Impairment Damage value
Assessment
DDT Pesticides
CO 2
Greenhouse effect
SO 2 Ecosystem
Acidification
NOx Impairment
P Eutrophication
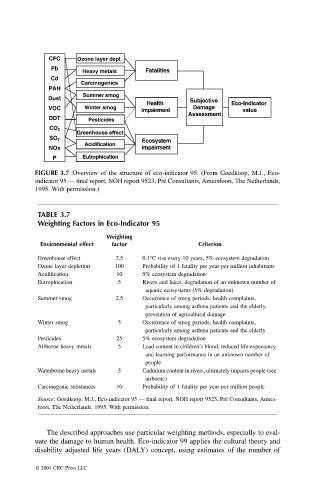
FIGURE 3.7 Overview of the structure of eco-indicator 95. (From Goedkoop, M.J., Eco-
indicator 95 — final report, NOH report 9523, Pré Consultants, Amersfoort, The Netherlands,
1995. With permission.)
TABLE 3.7
Weighting Factors in Eco-Indicator 95
Weighting
Environmental effect factor Criterion
Greenhouse effect 2.5 0.1°C rise every 10 years, 5% ecosystem degradation
Ozone layer depletion 100 Probability of 1 fatality per year per million inhabitants
Acidification 10 5% ecosystem degradation
Eutrophication 5 Rivers and lakes, degradation of an unknown number of
aquatic ecosystems (5% degradation)
Summer smog 2.5 Occurrence of smog periods, health complaints,
particularly among asthma patients and the elderly,
prevention of agricultural damage
Winter smog 5 Occurrence of smog periods, health complaints,
particularly among asthma patients and the elderly
Pesticides 25 5% ecosystem degradation
Airborne heavy metals 5 Lead content in children’s blood, reduced life expectancy
and learning performance in an unknown number of
people
Waterborne heavy metals 5 Cadmium content in rivers, ultimately impacts people (see
airborne)
Carcinogenic substances 10 Probability of 1 fatality per year per million people
Source: Goedkoop, M.J., Eco-indicator 95 — final report, NOH report 9523, Pré Consultants, Amers-
foort, The Netherlands, 1995. With permission.
The described approaches use particular weighting methods, especially to eval-
uate the damage to human health. Eco-indicator 99 applies the cultural theory and
disability adjusted life years (DALY) concept, using estimates of the number of
© 2004 CRC Press LLC