
Page 278 - Materials Chemistry, Second Edition
P. 278
L1644_C06.fm Page 251 Monday, October 20, 2003 12:06 PM
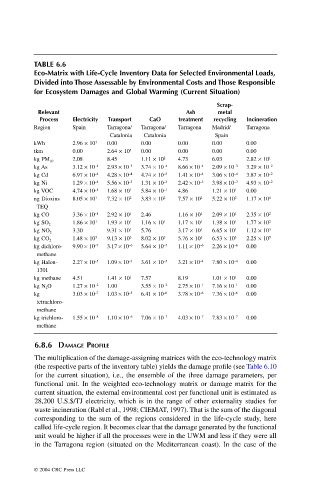
TABLE 6.6
Eco-Matrix with Life-Cycle Inventory Data for Selected Environmental Loads,
Divided into Those Assessable by Environmental Costs and Those Responsible
for Ecosystem Damages and Global Warming (Current Situation)
Scrap-
Relevant Ash metal
Process Electricity Transport CaO treatment recycling Incineration
Region Spain Tarragona/ Tarragona/ Tarragona Madrid/ Tarragona
Catalonia Catalonia Spain
kWh 2.96 ¥ 10 3 0.00 0.00 0.00 0.00 0.00
tkm 0.00 2.64 ¥ 10 4 0.00 0.00 0.00 0.00
2.08 8.45 1.11 ¥ 10 2 4.73 6.03 2.82 ¥ 10 1
kg PM 10
kg As 3.12 ¥ 10 –4 2.93 ¥ 10 –3 3.74 ¥ 10 –4 8.66 ¥ 10 –4 2.09 ¥ 10 –3 3.29 ¥ 10 –2
kg Cd 6.97 ¥ 10 –4 4.28 ¥ 10 –4 4.74 ¥ 10 –5 1.41 ¥ 10 –4 3.06 ¥ 10 –4 3.87 ¥ 10 –2
kg Ni 1.29 ¥ 10 –4 5.56 ¥ 10 –3 1.31 ¥ 10 –3 2.42 ¥ 10 –3 3.98 ¥ 10 –3 4.93 ¥ 10 –2
kg VOC 4.74 ¥ 10 –1 1.68 ¥ 10 1 5.84 ¥ 10 –1 4.86 1.21 ¥ 10 1 0.00
ng Dioxins 8.05 ¥ 10 1 7.32 ¥ 10 2 3.83 ¥ 10 2 7.57 ¥ 10 2 5.22 ¥ 10 2 1.17 ¥ 10 4
TEQ
kg CO 3.36 ¥ 10 –1 2.92 ¥ 10 1 2.46 1.16 ¥ 10 1 2.09 ¥ 10 1 2.35 ¥ 10 2
1.86 ¥ 10 1 1.93 ¥ 10 1 1.16 ¥ 10 1 1.17 ¥ 10 1 1.38 ¥ 10 1 1.77 ¥ 10 2
kg SO 2
3.30 9.31 ¥ 10 1 5.76 3.17 ¥ 10 1 6.65 ¥ 10 1 1.12 ¥ 10 3
kg NO 2
1.48 ¥ 10 3 9.13 ¥ 10 3 8.02 ¥ 10 3 5.76 ¥ 10 3 6.53 ¥ 10 3 2.25 ¥ 10 5
kg CO 2
kg dichloro- 9.90 ¥ 10 –7 3.17 ¥ 10 –6 5.64 ¥ 10 –7 1.11 ¥ 10 –6 2.26 ¥ 10 –6 0.00
methane
kg Halon- 2.27 ¥ 10 –5 1.09 ¥ 10 –3 3.61 ¥ 10 –5 3.21 ¥ 10 –4 7.80 ¥ 10 –4 0.00
1301
kg methane 4.51 1.41 ¥ 10 1 7.57 8.19 1.01 ¥ 10 1 0.00
kg N 2 O 1.27 ¥ 10 –2 1.00 3.55 ¥ 10 –2 2.75 ¥ 10 –1 7.16 ¥ 10 –1 0.00
kg 3.03 ¥ 10 –7 1.03 ¥ 10 –5 6.41 ¥ 10 –6 3.78 ¥ 10 –6 7.36 ¥ 10 –6 0.00
tetrachloro-
methane
kg trichloro- 1.55 ¥ 10 –8 1.10 ¥ 10 –6 7.06 ¥ 10 –7 4.03 ¥ 10 –7 7.83 ¥ 10 –7 0.00
methane
6.8.6 DAMAGE PROFILE
The multiplication of the damage-assigning matrices with the eco-technology matrix
(the respective parts of the inventory table) yields the damage profile (see Table 6.10
for the current situation), i.e., the ensemble of the three damage parameters, per
functional unit. In the weighted eco-technology matrix or damage matrix for the
current situation, the external environmental cost per functional unit is estimated as
28,200 U.S.$/TJ electricity, which is in the range of other externality studies for
waste incineration (Rabl et al., 1998; CIEMAT, 1997). That is the sum of the diagonal
corresponding to the sum of the regions considered in the life-cycle study, here
called life-cycle region. It becomes clear that the damage generated by the functional
unit would be higher if all the processes were in the UWM and less if they were all
in the Tarragona region (situated on the Mediterranean coast). In the case of the
© 2004 CRC Press LLC