
Page 280 - Materials Chemistry, Second Edition
P. 280
L1644_C06.fm Page 253 Monday, October 20, 2003 12:06 PM
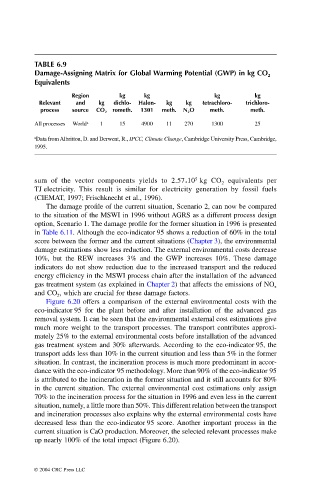
TABLE 6.9
Damage-Assigning Matrix for Global Warming Potential (GWP) in kg CO
2
Equivalents
Region kg kg kg kg
Relevant and kg dichlo- Halon- kg kg tetrachloro- trichloro-
process source CO 2 rometh. 1301 meth. N 2 O meth. meth.
All processes World a 1 15 4900 11 270 1300 25
a Data from Albritton, D. and Derwent, R., IPCC, Climate Change, Cambridge University Press, Cambridge,
1995.
5
sum of the vector components yields to 2.57 10 kg CO equivalents per
* 2
TJ electricity. This result is similar for electricity generation by fossil fuels
(CIEMAT, 1997; Frischknecht et al., 1996).
The damage profile of the current situation, Scenario 2, can now be compared
to the situation of the MSWI in 1996 without AGRS as a different process design
option, Scenario 1. The damage profile for the former situation in 1996 is presented
in Table 6.11. Although the eco-indicator 95 shows a reduction of 60% in the total
score between the former and the current situations (Chapter 3), the environmental
damage estimations show less reduction. The external environmental costs decrease
10%, but the REW increases 3% and the GWP increases 10%. These damage
indicators do not show reduction due to the increased transport and the reduced
energy efficiency in the MSWI process chain after the installation of the advanced
gas treatment system (as explained in Chapter 2) that affects the emissions of NO
x
and CO , which are crucial for these damage factors.
2
Figure 6.20 offers a comparison of the external environmental costs with the
eco-indicator 95 for the plant before and after installation of the advanced gas
removal system. It can be seen that the environmental external cost estimations give
much more weight to the transport processes. The transport contributes approxi-
mately 25% to the external environmental costs before installation of the advanced
gas treatment system and 30% afterwards. According to the eco-indicator 95, the
transport adds less than 10% in the current situation and less than 5% in the former
situation. In contrast, the incineration process is much more predominant in accor-
dance with the eco-indicator 95 methodology. More than 90% of the eco-indicator 95
is attributed to the incineration in the former situation and it still accounts for 80%
in the current situation. The external environmental cost estimations only assign
70% to the incineration process for the situation in 1996 and even less in the current
situation, namely, a little more than 50%. This different relation between the transport
and incineration processes also explains why the external environmental costs have
decreased less than the eco-indicator 95 score. Another important process in the
current situation is CaO production. Moreover, the selected relevant processes make
up nearly 100% of the total impact (Figure 6.20).
© 2004 CRC Press LLC