Page 351 - Materials Chemistry, Second Edition
P. 351

L1644_C08.fm  Page 315  Tuesday, October 21, 2003  3:03 PM


                              TABLE 8.8
                              Stages’ Contribution (%) in Each Impact Indicator
                                Impacts     Containers    Collection    Transport    Landfilling

                                WE            0.2           0.5           0.7         98.6
                                DNRR          8.6          27.9          40.8         22.7
                                AA            2.3          31.6          29.9         36.2
                                GE            0.1           0.6           0.6         98.7
                                AE            7.8           7.7          12.4         72.1
                                HT            2.1           9.3          16.8         71.8
                                TE            13.3         27.0          46.7         13.1
                                DOL           0.0           0.4           0.3         99.3
                                POF           0.8           3.6           3.2         92.5


                                         100%
                                         90%
                                         80%
                                         70%
                                         60%                                   Landfilling
                                                                               Transport
                                         50%
                                                                               Collection
                                         40%                                   Containers
                                         30%
                                         20%
                                         10%
                                          0%
                                              WE  DNRR  AA  GE  AE  HT  TE  DOL  POF


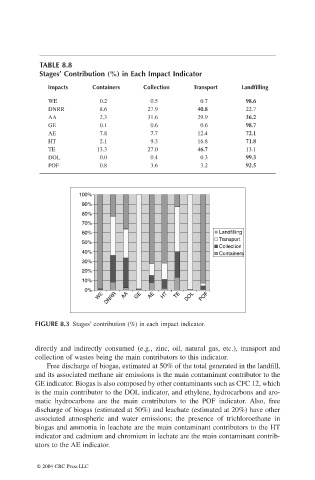
                             FIGURE 8.3 Stages’ contribution (%) in each impact indicator.


                             directly and indirectly consumed (e.g., zinc, oil, natural gas, etc.), transport and
                             collection of wastes being the main contributors to this indicator.
                                Free discharge of biogas, estimated at 50% of the total generated in the landfill,
                             and its associated methane air emissions is the main contaminant contributor to the
                             GE indicator. Biogas is also composed by other contaminants such as CFC 12, which
                             is the main contributor to the DOL indicator, and ethylene, hydrocarbons and aro-
                             matic hydrocarbons are the main contributors to the POF indicator.  Also, free
                             discharge of biogas (estimated at 50%) and leachate (estimated at 20%) have other
                             associated atmospheric and water emissions; the presence of trichloroethane in
                             biogas and ammonia in leachate are the main contaminant contributors to the HT
                             indicator and cadmium and chromium in lechate are the main contaminant contrib-
                             utors to the AE indicator.

                             © 2004 CRC Press LLC
   346   347   348   349   350   351   352   353   354   355   356