
Page 354 - Materials Chemistry, Second Edition
P. 354
L1644_C08.fm Page 318 Tuesday, October 21, 2003 3:03 PM
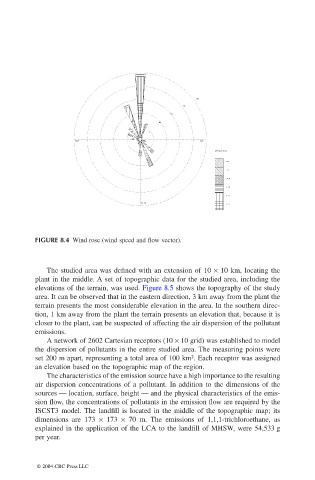
FIGURE 8.4 Wind rose (wind speed and flow vector).
The studied area was defined with an extension of 10 × 10 km, locating the
plant in the middle. A set of topographic data for the studied area, including the
elevations of the terrain, was used. Figure 8.5 shows the topography of the study
area. It can be observed that in the eastern direction, 3 km away from the plant the
terrain presents the most considerable elevation in the area. In the southern direc-
tion, 1 km away from the plant the terrain presents an elevation that, because it is
closer to the plant, can be suspected of affecting the air dispersion of the pollutant
emissions.
A network of 2602 Cartesian receptors (10 × 10 grid) was established to model
the dispersion of pollutants in the entire studied area. The measuring points were
set 200 m apart, representing a total area of 100 km . Each receptor was assigned
2
an elevation based on the topographic map of the region.
The characteristics of the emission source have a high importance to the resulting
air dispersion concentrations of a pollutant. In addition to the dimensions of the
sources — location, surface, height — and the physical characteristics of the emis-
sion flow, the concentrations of pollutants in the emission flow are required by the
ISCST3 model. The landfill is located in the middle of the topographic map; its
dimensions are 173 × 173 × 70 m. The emissions of 1,1,1-trichloroethane, as
explained in the application of the LCA to the landfill of MHSW, were 54,533 g
per year.
© 2004 CRC Press LLC