
Page 355 - Materials Chemistry, Second Edition
P. 355
L1644_C08.fm Page 319 Tuesday, October 21, 2003 3:03 PM
350
300
250
200
150
100
50
0
FIGURE 8.5 Topographic map of the study area.
1,1,1-TRICHLOROETHANE
0.0007
0.00065
0.0006
0.00055
0.0005
0.00045
0.0004
0.00035
0.0003
0.00025
0.0002
0.00015
0.0001
5E-005
0
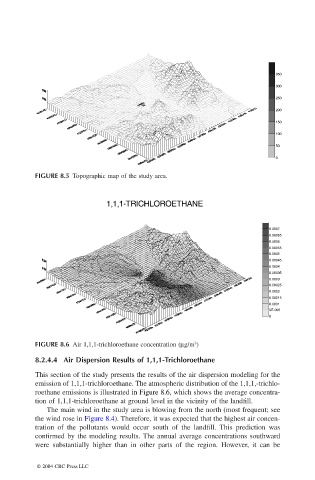
FIGURE 8.6 Air 1,1,1-trichloroethane concentration (µg/m )
3
8.2.4.4 Air Dispersion Results of 1,1,1-Trichloroethane
This section of the study presents the results of the air dispersion modeling for the
emission of 1,1,1-trichloroethane. The atmospheric distribution of the 1,1,1,-trichlo-
roethane emissions is illustrated in Figure 8.6, which shows the average concentra-
tion of 1,1,1-trichloroethane at ground level in the vicinity of the landfill.
The main wind in the study area is blowing from the north (most frequent; see
the wind rose in Figure 8.4). Therefore, it was expected that the highest air concen-
tration of the pollutants would occur south of the landfill. This prediction was
confirmed by the modeling results. The annual average concentrations southward
were substantially higher than in other parts of the region. However, it can be
© 2004 CRC Press LLC