
Page 359 - Materials Chemistry, Second Edition
P. 359
L1644_C08.fm Page 323 Tuesday, October 21, 2003 3:03 PM
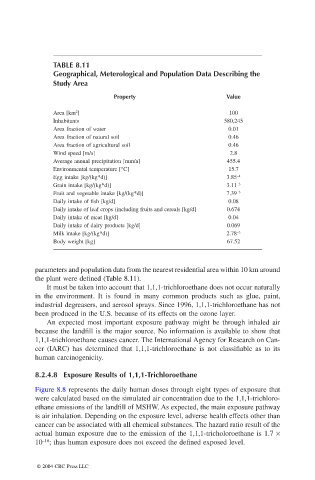
TABLE 8.11
Geographical, Meterological and Population Data Describing the
Study Area
Property Value
2
Area [km ] 100
Inhabitants 580,245
Area fraction of water 0.01
Area fraction of natural soil 0.46
Area fraction of agricultural soil 0.46
Wind speed [m/s] 2.8
Average annual precipitation [mm/a] 455.4
Environmental temperature [°C] 15.7
Egg intake [kg/(kg*d)] 3.85 –4
Grain intake [kg/(kg*d)] 3.11 –3
Fruit and vegetable intake [kg/(kg*d)] 7.39 –3
Daily intake of fish [kg/d] 0.08
Daily intake of leaf crops (including fruits and cereals [kg/d] 0.674
Daily intake of meat [kg/d] 0.04
Daily intake of dairy products [kg/d] 0.069
Milk intake [kg/(kg*d)] 2.78 –3
Body weight [kg] 67.52
parameters and population data from the nearest residential area within 10 km around
the plant were defined (Table 8.11).
It must be taken into account that 1,1,1-trichloroethane does not occur naturally
in the environment. It is found in many common products such as glue, paint,
industrial degreasers, and aerosol sprays. Since 1996, 1,1,1-trichloroethane has not
been produced in the U.S. because of its effects on the ozone layer.
An expected most important exposure pathway might be through inhaled air
because the landfill is the major source. No information is available to show that
1,1,1-trichloroethane causes cancer. The International Agency for Research on Can-
cer (IARC) has determined that 1,1,1-trichloroethane is not classifiable as to its
human carcinogenicity.
8.2.4.8 Exposure Results of 1,1,1-Trichloroethane
Figure 8.8 represents the daily human doses through eight types of exposure that
were calculated based on the simulated air concentration due to the 1,1,1-trichloro-
ethane emissions of the landfill of MSHW. As expected, the main exposure pathway
is air inhalation. Depending on the exposure level, adverse health effects other than
cancer can be associated with all chemical substances. The hazard ratio result of the
actual human exposure due to the emission of the 1,1,1-tricholoroethane is 1.7 ×
–10
10 ; thus human exposure does not exceed the defined exposed level.
© 2004 CRC Press LLC