
Page 44 - Materials Chemistry, Second Edition
P. 44
L1644_C01.fm Page 20 Monday, October 20, 2003 11:46 AM
1.5.4.4 Cost-Effectiveness Analysis (CEA) and Cost-Benefit
Analysis (CBA)
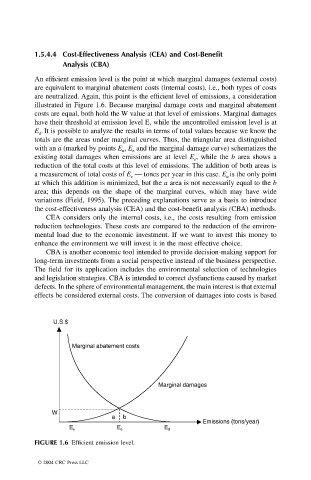
An efficient emission level is the point at which marginal damages (external costs)
are equivalent to marginal abatement costs (internal costs), i.e., both types of costs
are neutralized. Again, this point is the efficient level of emissions, a consideration
illustrated in Figure 1.6. Because marginal damage costs and marginal abatement
costs are equal, both hold the W value at that level of emissions. Marginal damages
have their threshold at emission level E, while the uncontrolled emission level is at
E . It is possible to analyze the results in terms of total values because we know the
d
totals are the areas under marginal curves. Thus, the triangular area distinguished
with an a (marked by points E , E and the marginal damage curve) schematizes the
u
e
existing total damages when emissions are at level E , while the b area shows a
e
reduction of the total costs at this level of emissions. The addition of both areas is
a measurement of total costs of E — tones per year in this case. E is the only point
e
u
at which this addition is minimized, but the a area is not necessarily equal to the b
area; this depends on the shape of the marginal curves, which may have wide
variations (Field, 1995). The preceding explanations serve as a basis to introduce
the cost-effectiveness analysis (CEA) and the cost-benefit analysis (CBA) methods.
CEA considers only the internal costs, i.e., the costs resulting from emission
reduction technologies. These costs are compared to the reduction of the environ-
mental load due to the economic investment. If we want to invest this money to
enhance the environment we will invest it in the most effective choice.
CBA is another economic tool intended to provide decision-making support for
long-term investments from a social perspective instead of the business perspective.
The field for its application includes the environmental selection of technologies
and legislation strategies. CBA is intended to correct dysfunctions caused by market
defects. In the sphere of environmental management, the main interest is that external
effects be considered external costs. The conversion of damages into costs is based
U.S.$
Marginal abatement costs
Marginal damages
W
a b
Emissions (tons/year)
E u E e E d
FIGURE 1.6 Efficient emission level.
© 2004 CRC Press LLC