
Page 240 - Integrated Wireless Propagation Models
P. 240
218 C h a p t e r F o u r
in Fig. 4.2.7.5 for the random-run case 2. Each figure shows the received signal strength
indicator (RSSI) and the cumulative distribution function (CDF) on a particular run.
A large scale (in miles) is used to plot RSSI in each figure. We find that a deviation
between the measured and predicted at 60% data is about 6 dB in all five figures. The
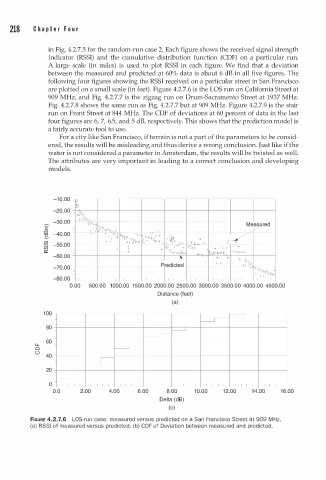
following four figures showing the RSSI received on a particular street in San Francisco
are plotted on a small scale (in feet). Figure 4.2.7.6 is the LOS run on California Street at
909 MHz, and Fig. 4.2.7.7 is the zigzag run on Drum-Sacramento Street at 1937 MHz.
Fig. 4.2.7.8 shows the same run as Fig. 4.2.7.7 but at 909 MHz. Figure 4.2.7.9 is the stair
run on Front Street at 844 MHz. The CDF of deviations at 60 percent of data in the last
four figures are 6, 7, 6.5, and 5 dB, respectively. This shows that the prediction model is
a fairly accurate tool to use.
For a city like San Francisco, if terrain is not a part of the parameters to be consid
ered, the results will be misleading and thus derive a wrong conclusion. Just like if the
water is not considered a parameter in Amsterdam, the results will be twisted as well.
The attributes are very important in leading to a correct conclusion and developing
models.
-10.00
�.
-20.00
+:'! � ++
-30.00 Me�ured
E' :)l: � ;j 7 � �. +
+ +
co -40.00 +
:s + + f1"tii! �'+l ++ t 'P- tlt! + + + + + /
� +
O �+ t+;e
+ + + �"- +
Q
ii5 -50.00 + + + + +++ � \!? ++ + + + +
+
(f) + + + dJ;i + + +
a: + ocoo� ++#. \ {/t t:li- ':11' P=oo
-60.00 * -Hi-
\ + + + +q
-70.00 Predicted �+ '$>
+
-80.00 �;;s�
0.00 500.00 1 0 00.00 1 5 00.00 2000.00 2500.00 3000.00 3500.00 4000.00 4500.00
Distance (feet)
(a)
1 0 0
__r---
80 ,-------
f--------l
�
LL. 60
0 w
0 40
__j
20
u
0
0.0 2.00 4.00 6.00 8.00 1 0 .00 1 2 .00 14.00 1 6 .00
Delta (dB)
(b)
M
FIGURE 4.2.7.6 LOS-run case: measured versus predicted on a San Francisco Street at 909 H z.
(a) RSSI of measured versus predicted. (b) CDF of Deviation between measured and predicted.