
Page 242 - Integrated Wireless Propagation Models
P. 242
220 C h a p t e r F o u r
-20.00
�
--40.00
Measured
E' �'t� v
co -60.00 "'\'
2. -H-' + + + ++ \ _: $ + + � + + / 0
+ + ++.+:tt+
1i5 +'-� � ;'\t 1it>};t : + + /++ + '*" + + + -t + �
i
(/) -80.00 + + +
a: � "!' � ott\�:· o ooo o � ++r + + :t*+
+ +p
-100.00 f +t � / OOo ,f: ���
+ I
Predicted f l h "\¥
-120.00
0.00 500.00 1 0 00.00 1 5 00.00 2000.00 2500.00 3000.00 3500.00 4000.00 4500.00
Distance (feet)
(a)
1 . 00
�
�
0.80 �
f-r
0.60 �
u..
0 l--r
()
0.40
�
0.20
Lr
0.00
0.0 5.00 1 0 .00 1 5 .00 20.00 25.00 30.00 35.00 40.00
Delta (dB)
(b)
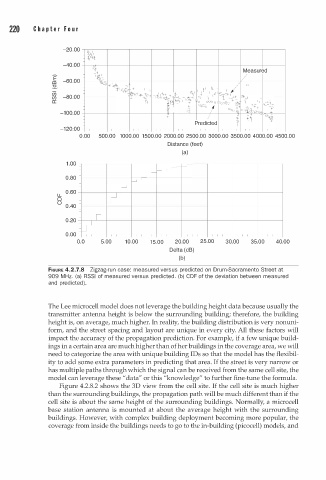
FIGURE 4.2.7.8 Zigzag-run case: measured versus predicted on Drum-Sacramento Street at
909 MHz. (a) RSSI of measured versus predicted. (b) CDF of the deviation between measured
and predicted . )
The Lee microcell model does not leverage the building height data because usually the
transmitter antenna height is below the surrounding building; therefore, the building
height is, on average, much higher. In reality, the building distribution is very nonuni
form, and the street spacing and layout are unique in every city. All these factors will
impact the accuracy of the propagation prediction. For example, if a few unique build
ings in a certain area are much higher than of her buildings in the coverage area, we will
need to categorize the area with unique building IDs so that the model has the flexibil
ity to add some extra parameters in predicting that area. If the street is very narrow or
has multiple paths through which the signal can be received from the same cell site, the
model can leverage these "data" or this "knowledge" to further fine-tune the formula.
Figure 4.2.8.2 shows the 3D view from the cell site. If the cell site is much higher
than the surrounding buildings, the propagation path will be much different than if the
cell site is about the same height of the surrounding buildings. Normally, a microcell
base station antenna is mounted at about the average height with the surrounding
buildings. However, with complex building deployment becoming more popular, the
coverage from inside the buildings needs to go to the in-building (picocell) models, and