
Page 243 - Integrated Wireless Propagation Models
P. 243
M i c r o c e l l P r e d i c t i o n M o d e l s 221
20.00
0.00
-20.00 §,a
E' i +
� -40.00 '&
�� Pred�ted
U5 -60.00 19 + + + ;
+
� +it-
(j') t 1 V�� -i
c: + +� +
-80.00 � + * ++-n. .L +
+
n co
+ r f\1 + +++ '],. ! + '+�� fu +� <f!l co "'']
t ,(" ++ + ++ + {tt
-100.00 + + 0 "' "' :t + + pooco�
;:
++ + :+ -¥-
MeasU:ed + +
-120.00
0.00 500.00 1 0 00.00 1 5 00.00 2000.00 2500.00 3000.00 3500.00 4000.00 4500.00
Distance (feet)
(a)
1 . 00
�
�
0.80
/
0.60
LL
0
0 �
0.40
j
0.20
J
0.00
0.0 5.00 1 0 .00 1 5 .00 20.00 25.00 30.00
Delta (dB)
(b)
M
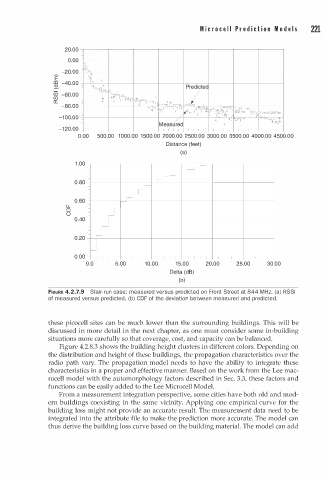
FIGURE 4.2.7.9 Stair-run case: measured versus predicted on Front Street at 844 H z. (a) RSSI
of measured versus predicted. (b) CDF of the deviation between measured and predicted.
these picocell sites can be much lower than the surrounding buildings. This will be
discussed in more detail in the next chapter, as one must consider some in-building
situations more carefully so that coverage, cost, and capacity can be balanced.
Figure 4.2.8.3 shows the building height clusters in different colors. Depending on
the distribution and height of these buildings, the propagation characteristics over the
radio path vary. The propagation model needs to have the ability to integrate these
characteristics in a proper and effective manner. Based on the work from the Lee mac
rocell model with the automorphology factors described in Sec. 3.3, these factors and
functions can be easily added to the Lee Microcell Model.
From a measurement integration perspective, some cities have both old and mod
ern buildings coexisting in the same vicinity. Applying one empirical curve for the
building loss might not provide an accurate result. The measurement data need to be
integrated into the attribute file to make the prediction more accurate. The model can
thus derive the building loss curve based on the building material. The model can add