
Page 236 - Integrated Wireless Propagation Models
P. 236
214 C h a p t e r F o u r
The route types were as follows:
1 . Along a straight line and maintaining LOS
2. Zigzag kind of route
3. Route following a staircase pattern
4. Random routes
Figure 4.2.6.2 displays the variation of terrain contour in the San Francisco region.
There is a lot of undulation of the terrain, and this is within a small region of 2 miles.
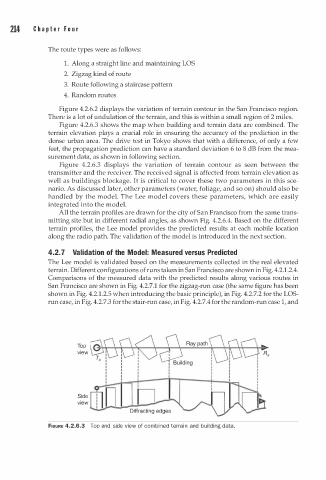
Figure 4.2.6.3 shows the map when building and terrain data are combined. The
terrain elevation plays a crucial role in ensuring the accuracy of the prediction in the
dense urban area. The drive test in Tokyo shows that with a difference, of only a few
feet, the propagation prediction can have a standard deviation 6 to 8 dB from the mea
surement data, as shown in following section.
Figure 4.2.6.3 displays the variation of terrain contour as seen between the
transmitter and the receiver. The received signal is affected from terrain elevation as
well as buildings blockage. It is critical to cover these two parameters in this sce
nario. As discussed later, other parameters (water, foliage, and so on) should also be
handled by the model. The Lee model covers these parameters, which are easily
integrated into the model.
All the terrain profiles are drawn for the city of San Francisco from the same trans
mitting site but in different radial angles, as shown Fig. 4.2.6.4. Based on the different
terrain profiles, the Lee model provides the predicted results at each mobile location
along the radio path. The validation of the model is introduced in the next section.
4.2. 7 Validation of the Model: Measured versus Predicted
The Lee model is validated based on the measurements collected in the real elevated
terrain. Different configurations of runs taken in San Francisco are shown in Fig. 4.2.1.2.4.
Comparisons of the measured data with the predicted results along various routes in
San Francisco are shown in Fig. 4.2.7.1 for the zigzag-run case (the same figure has been
shown in Fig. 4.2.1.2.5 when introducing the basic principle), in Fig. 4.2.7.2 for the LOS
run case, in Fig. 4.2.7.3 for the stair-run case, in Fig. 4.2.7.4 for the random-run case 1, and
Top
view
Side
view
Diffracting edges
FIGURE 4.2.6.3 Top and side view of combined terrain and building data.