
Page 233 - Integrated Wireless Propagation Models
P. 233
M i c r o c e l l P r e d i c t i o n M o d e l s 211
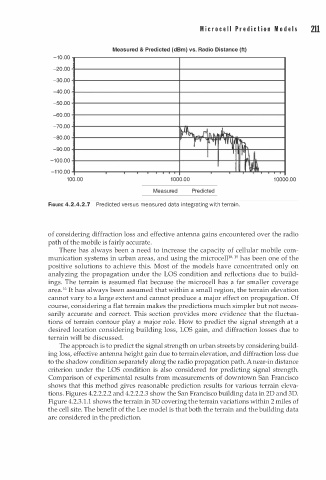
Measured & Predicted (dBm) vs. Radio Distance (ft)
-10.00
-20.00
-30.00
-40.00
-50.00
-60.00
-70.00
� .f i\ A . 1h..
-80.00
rv l'"t
-90.00 ,,� �
I I I, I
-100.00
u�
-11 0 .00
1 0 0.00 1 0 00.00 1 0 000.00
1 - Measured - Predicted I
FIGURE 4.2.4.2.7 Predicted versus measured data i n tegrati n g with terra i n .
o f considering diffraction loss and effective antenna gains encountered over the radio
path of the mobile is fairly accurate.
There has always been a need to increase the capacity of cellular mobile com
10
munication systems in urban areas, and using the microcell • 15 has been one of the
positive solutions to achieve this. Most of the models have concentrated only on
analyzing the propagation under the LOS condition and reflections due to build
ings. The terrain is assumed flat because the microcell has a far smaller coverage
1
area. 6 It has always been assumed that within a small region, the terrain elevation
cannot vary to a large extent and cannot produce a major effect on propagation. Of
course, considering a flat terrain makes the predictions much simpler but not neces
sarily accurate and correct. This section provides more evidence that the fluctua
tions of terrain contour play a major role. How to predict the signal strength at a
desired location considering building loss, LOS gain, and diffraction losses due to
terrain will be discussed.
The approach is to predict the signal strength on urban streets by considering build
ing loss, effective antenna height gain due to terrain elevation, and diffraction loss due
to the shadow condition separately along the radio propagation path. A near-in distance
criterion under the LOS condition is also considered for predicting signal strength.
Comparison of experimental results from measurements of downtown San Francisco
shows that this method gives reasonable prediction results for various terrain eleva
tions. Figures 4.2.2.2.2 and 4.2.2.2.3 show the San Francisco building data in 2D and 3D.
Figure 4.2.3.1.1 shows the terrain in 3D covering the terrain variations within 2 miles of
the cell site. The benefit of the Lee model is that both the terrain and the building data
are considered in the prediction.