Page 231 - Integrated Wireless Propagation Models
P. 231

M i c r o c e  I   P r e d i c t i o n  M o d e I s   209
                                                                   I

                    230 ft         3
                     1 8 4 ft
                     1 3 8 ft
                     82 ft
                     46 ft
                      0 ft   0    0.2     0.4      0.6     0.8       1 . 0    1 . 2
                                                  Miles from site
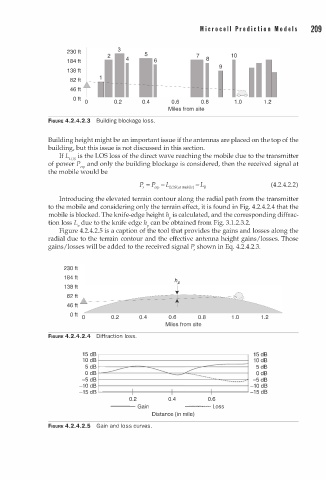
               FIGURE 4.2.4.2.3  Building blockage loss.

               Building height might be an important issue if the antennas are placed on the top of the
               building, but this issue is not discussed in this section.
                  If L ws is the LOS loss of the direct wave reaching the mobile due to the transmitter
               of power P and only the building blockage is considered, then the received signal at
                        erp
               the mobile would be
                                         P ,  =  p erp  - LOS ( t Mobile)  - B   (4.2.4.2.2)
                                                 L
                                                           L
                                                     n
                  Introducing the elevated terrain contour along the radial path from the transmitter
               to the mobile and considering only the terrain effect, it is found in Fig. 4.2.4.2.4 that the
               mobile is blocked. The knife-edge height h is calculated, and the corresponding diffrac­
                                                  P
               tion loss L" due to the knife edge h can be obtained from Fig. 3.1.2.3.2.
                                            P
                  Figure 4.2.4.2.5 is a caption of the tool that provides the gains and losses along the
               radial due to the terrain contour and the effective antenna height gains/losses. Those
               gains/losses will be added to the received signal P , shown in Eq. 4.2.4.2.3.


                    230 ft
                    1 8 4 ft
                                                    hp
                    1 3 8 ft
                                                    +
                    82 ft
                                                    ...
                    46 ft
                     O f t   0   0.2     0.4      0.6      0.8      1 . 0    1 . 2
                                                 Miles from site
               FIGURE 4.2.4.2.4  Diffraction loss.


                           !I
                                                                           �
                         1 I �  :-s; � <--G----                   - - - --- - - -- - -1  �  !I

                        -10 dB                    -         -            · -10 dB
                        -15 dB �· -- -- -- -- r- -- -- -- -- +- -- -- -- -- �-- -- -- � -15 d B
                                      0.2         0.4        0.6
                                 --- Gain              •••••••••• •••  Loss
                                             Distance (in mile)
               FIGURE 4.2.4.2.5  Gain and loss curves.
   226   227   228   229   230   231   232   233   234   235   236