
Page 232 - Integrated Wireless Propagation Models
P. 232
210 C h a p t e r F o u r
Measured & Predicted (dBm) vs. Radio Distance (ft)
-10.00
-20.00
-30.00
-40.00
-50.00
-60.00
-70.00
fth A. AM � J
-80.00
� ��
(.
-90.00
I
-100.00 r-t�
l l •
-11 0 .00
1 0 0.00 1 0 00.00 1 0 000.00
1 - Measured - Predicted I
i
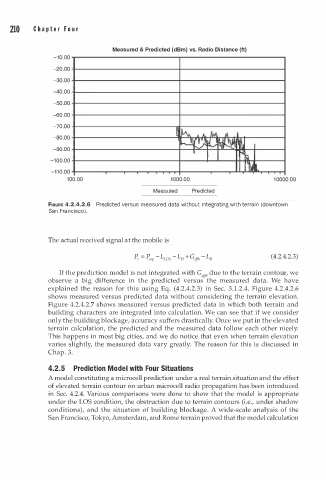
FIGURE 4.2.4.2.6 Predicted versus measured data without n tegrating with terr i n (downtown
a
a
San Fr n cisco).
The actual received signal at the mobile is
(4.2.4.2.3)
If the prediction model is not integrated with G,1fl due to the terrain contour, we
observe a big difference in the predicted versus the measured data. We have
explained the reason for this using Eq. (4.2.4.2.3) in Sec. 3 . 1 .2.4. Figure 4.2.4.2.6
shows measured versus predicted data without considering the terrain elevation.
Figure 4.2.4.2.7 shows measured versus predicted data in which both terrain and
building characters are integrated into calculation. We can see that if we consider
only the building blockage, accuracy suffers drastically. Once we put in the elevated
terrain calculation, the predicted and the measured data follow each other nicely.
This happens in most big cities, and we do notice that even when terrain elevation
varies slightly, the measured data vary greatly. The reason for this is discussed in
Chap. 3.
4.2.5 Prediction Model with Four Situations
A model constituting a microcell prediction under a real terrain situation and the effect
of elevated terrain contour on urban microcell radio propagation has been introduced
in Sec. 4.2.4. Various comparisons were done to show that the model is appropriate
under the LOS condition, the obstruction due to terrain contours (i.e., under shadow
conditions), and the situation of building blockage. A wide-scale analysis of the
San Francisco, Tokyo, Amsterdam, and Rome terrain proved that the model calculation