
Page 344 - Integrated Wireless Propagation Models
P. 344
322 C h a p t e r F i v e
LOS comparison
1 1 0 9
1 0 5 n 8
0
1 0 0 /I 7 en � LOS Loss . 1
""0
A / v -�
95 Q)
0
en 6 () _._ LOS Loss . 1 5
-o 90 _L./1 c
Q)
-� 5 Q;
(/) 85 _ // I :t::
(/)
.2 4 '5 LOS Loss 0.2
.r:: 80 '� I E
::::J
cr;
0.. / I 3 'g LEE LOS
75 :2:
70 �__...._ /--.1 2 Medium
I v difference
65
�
/
60 0
0 20 40 60 80 1 0 0 1 2 0 1 4 0 1 6 0 1 8 0 200
Distance in meter
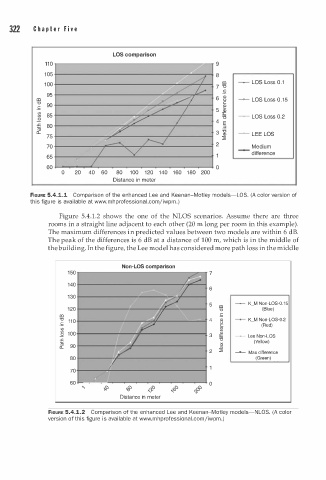
FIGURE 5.4.1.1 Comparison of the enhanced Lee and Keenan-Motley models-LOS. (A color version of
this figure is available at www.mhprofessional.com i wpm. )
j
4
Figure 5. . 1 . 2 shows the one o f the NLOS scenarios. Assume there are three
)
rooms in a straight line adjacent to each other (20 m long per room in this example .
i
The maximum differences n predicted values between two models are within 6 dB.
1
The peak of the differences is 6 dB at a distance of 0 0 m, which is in the middle of
the building. In the figure, the Lee model has considered more path loss in the middle
Non-LOS comparison
1 5 0 7
1 4 0
6
1 3 0
5 � K_M Non-LOS-0.15
1 2 0 en (Blue)
"0
en -�
"0 1 1 0 4 Q) K_M Non-LOS-0.2
-� {) (Red)
c
(/) �
(/) Q)
..Q 1 0 0 3 :t:: - Lee Non-LOS
.r:: '5 (Yellow)
cr; X
0.. 90 C1l
2 :2: - Max difference
80 (Green)
70
60 0
" () () () () ()
� '0 ,<t- " X> ']) Rl
Distance in meter
FIGURE 5.4.1.2 Comparison of the enhanced Lee and Keenan-Motley models-NLOS. (A color
version of this figure is available at www.mhprofessional.comjiwpm. )