
Page 345 - Integrated Wireless Propagation Models
P. 345
I n - B u i l d i n g ( P i c o c e l l ) P r e d i c t i o n M o d e l s 323
Non-LOS comparison - end of building
1 2 0 14
1 1 0 1 2
� K_M Non-LOS-0.15
10 co
""0
co 1 0 0
""0 .� -- K_M Non-LOS-0.2
Q)
.� 8 (.)
en 90 c
en �
_Q Q) Lee Non-LOS
..c 6 ll=
'5
Cii
c... 80 X
ctl
4 :2: --..-- Max difference
70 2
60 0
"
IX� <o� ,<t- � " reP ']; �
�
Distance in meter
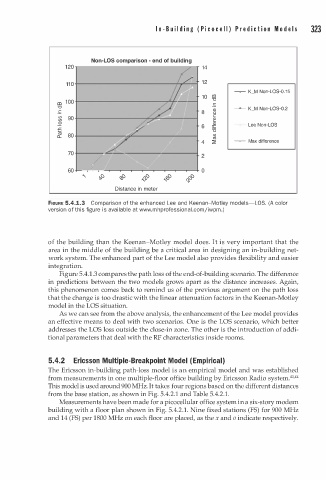
FIGURE 5.4.1.3 Comparison of the enhanced Lee and Keenan-Motley models-LOS. (A color
version of this figure is available at www.mhprofessional.com/iwpm. )
I
o f the building than the Keenan-Motley model does. t i s very important that the
area in the middle of the building be a critical area in designing an in-building net
work system. The enhanced part of the Lee model also provides flexibility and easier
integration.
1
Figure 5.4. . 3 compares the path loss of the end-of-building scenario. The difference
in predictions between the two models grows apart as the distance increases. Again,
this phenomenon comes back to remind us of the previous argument on the path loss
that the change is too drastic with the linear attenuation factors in the Keenan-Motley
model in the LOS situation.
As we can see from the above analysis, the enhancement of the Lee model provides
an effective means to deal with two scenarios. One is the LOS scenario, which better
addresses the LOS loss outside the close-in zone. The other is the introduction of addi
tional parameters that deal with the RF characteristics inside rooms.
5.4.2 Ericsson u ltiple-Breakpoint Model E mpirical)
M
(
The Ericsson in-building path-loss model is an empirical model and was established
from measurements in one multiple-floor office building by Ericsson Radio system.43A4
This model is used around 900 MHz. It takes four regions based on the different distances
from the base station, as shown in Fig. 5.4.2.1 and Table 5.4.2.1.
Measurements have been made for a picocellular office system in a six-story modem
building with a floor plan shown in Fig. 5.4.2.1. Nine fixed stations (FS) for 900 MHz
and 14 (FS) per 1800 MHz on each floor are placed, as the x and o indicate respectively.