Page 412 - Integrated Wireless Propagation Models
P. 412
390 C h a p t e r S i x
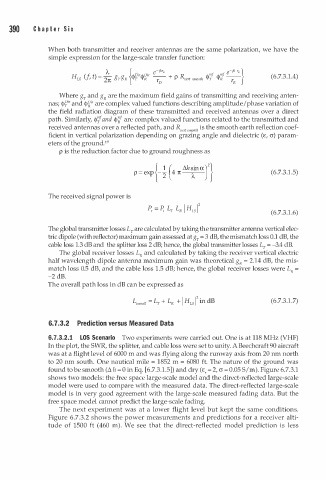
When both transmitter and receiver antennas are the same polarization, we have the
simple expression for the large-scale transfer function:
e -jk r, }
A
e -jkro
{ Dir Dir
ref ref
(
g g
r
+ R
HLS f, - t) - 27t T R <Jlr <I>R ----r; P vert snwotlt <l> <I>R ---r;;- (6.7.3.1.4)
Where gr and g are the maximum field gains of transmitting and receiving anten
R
;
;,
nas; <I>?' and <1>� are complex valued functions describing amplitude/phase variation of
the field radiation diagram of these transmitted and received antennas over a direct
path. Similarly, <1>1 and <1>1 are complex valued functions related to the transmitted and
received antennas over a reflected path, and R vertsmoo u, is the smooth earth reflection coef
ficient in vertical polarization depending on grazing angle and dielectric (£, cr) param
eters of the ground.49
p i s the reduction factor due to ground roughness as
{ 1 ( �hsina)2}
p = e xp - 2 4 1t (6.7.3.1.5)
'A
The received signal power is
(6.7.3.1.6)
The global transmitter losses Lr are calculated by taking the transmitter antenna vertical elec
tric dipole (with reflector) maximum gain assessed at gr = 3 dB, the mismatch loss 0.1 dB, the
cable loss 1.3 dB and the splitter loss 2 dB; hence, the global transmitter losses Lr = -3.4 dB.
The global receiver losses L and calculated by taking the receiver vertical electric
R
half wavelength dipole antenna maximum gain was theoretical g R = 2.14 dB, the mis
1
match loss 0.5 dB, and the cable loss . 5 dB; hence, the global receiver losses were L R =
-2 dB.
The overall path loss in dB can be expressed as
(6.7.3.1.7)
6. 7 .3 .2 Prediction versus Measured Data
6.7.3. . 1 LOS Scenario Two experiments were carried out. One is at 118 MHz (VHF)
2
In the plot, the SWR, the splitter, and cable loss were set to unity. A Beechcraft 90 aircraft
was at a flight level of 6000 m and was flying along the runway axis from 20 nm north
1
to 20 nm south. One nautical mile = 8 52 m = 6080 ft. The nature of the ground was
found to be smooth (� h = 0 in Eq. [6.7.3.1.5]) and dry (£, = 2, cr = 0.05 S/m). Figure 6.7.3.1
shows two models: the free space large-scale model and the direct-reflected large-scale
model were used to compare with the measured data. The direct-reflected large-scale
model is in very good agreement with the large-scale measured fading data. But the
free space model cannot predict the large-scale fading.
The next experiment was at a lower flight level but kept the same conditions.
Figure 6.7.3.2 shows the power measurements and predictions for a receiver alti
tude of 1500 ft (460 m). We see that the direct-reflected model prediction is less

