
Page 225 - Intelligent Digital Oil And Gas Fields
P. 225
Workflow Automation and Intelligent Control 177
5.4 SMART PRODUCTION SURVEILLANCE FOR DAILY
OPERATIONS
During the last decade, traditional production monitoring has been
done using stand-alone applications that require extensive training and a
step-by-step processes, which can be tedious and time consuming. These
commercial applications display a series of UIs showing Cartesian plots, time
series plots, pie/bar graphics, and geographical maps and tables to organize
production data. The applications provide excellent solutions for monthly
decisions, but in today’s DOF we use real-time data. The benefit of using
real-time data is to reduce production downtime as much as possible.
Two or three days of production losses can mean hundreds of barrels of
oil; reducing or preventing production downtime can affect 1%–2% of
the total financial impact of a company. Schotanus et al. (2013) have gen-
erated a production deferments reports driven by exception-based surveil-
lance process by recommending a series of associated well remedial actions
which have resulted in an 8% production gain.
Smart production surveillance is a continuous real-time operation that
monitors well surface and down-hole data, helped by predictive tools to fore-
see upcoming events or unexpected production performance issues, such as
early water or gas breakthrough. Smart production surveillance uses a series
of UIs enriched with iterative plots, infographic data, maps, and custom lay-
outs that generate actions and recommendations, and pulls up the data
required for further analysis. Al-Abbasi et al. (2013) has defined smart pro-
duction surveillance as an advanced workflow that helps control production
and provides surveillance in real time, at various monitoring levels and Al-
Jasmi et al. (2013c) developed a series of UIs that allow monitoring, generate
alarms, provide diagnostic, and production prediction generation all-in-one.
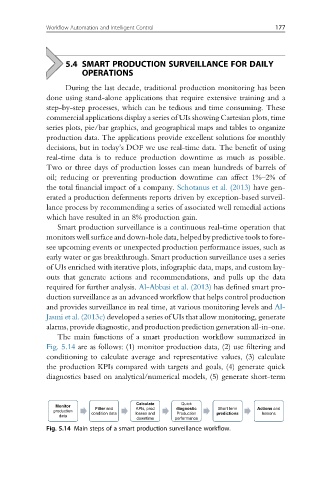
The main functions of a smart production workflow summarized in
Fig. 5.14 are as follows: (1) monitor production data, (2) use filtering and
conditioning to calculate average and representative values, (3) calculate
the production KPIs compared with targets and goals, (4) generate quick
diagnostics based on analytical/numerical models, (5) generate short-term
Calculate Quick
Monitor Filter and KPls, prod diagnostic Short term Actions and
production condition data losses and Production predictions lessons
data
downtime performance
Fig. 5.14 Main steps of a smart production surveillance workflow.