
Page 104 - Intermediate Statistics for Dummies
P. 104
09_045206 ch04.qxd 2/1/07 9:49 AM Page 83
error in your data set, you remove that data point (or fix it if possible) and
analyze the data without it. However, if you can’t explain away the problem
by finding a mistake, you must think of another approach.
If you can’t find a mistake that caused the outlier, you don’t necessarily have
to trash your model; after all, it’s only one data point. What you do is analyze
the data with that data point and analyze the data again without it. Then
report and compare both analyses. This comparison can give you a sense of
how influential that one data point is. It may lead other researchers to con-
duct more research to zoom in on the issue you brought to the surface.
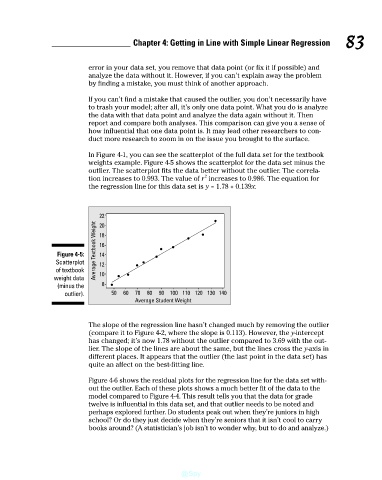
In Figure 4-1, you can see the scatterplot of the full data set for the textbook
weights example. Figure 4-5 shows the scatterplot for the data set minus the
outlier. The scatterplot fits the data better without the outlier. The correla-
2
tion increases to 0.993. The value of r increases to 0.986. The equation for
the regression line for this data set is y = 1.78 + 0.139x.
22 Chapter 4: Getting in Line with Simple Linear Regression 83
Average Textbook Weight 18
20
16
Figure 4-5: 14
Scatterplot 12
of textbook 10
weight data
(minus the 8
outlier). 50 60 70 80 90 100 110 120 130 140
Average Student Weight
The slope of the regression line hasn’t changed much by removing the outlier
(compare it to Figure 4-2, where the slope is 0.113). However, the y-intercept
has changed; it’s now 1.78 without the outlier compared to 3.69 with the out-
lier. The slope of the lines are about the same, but the lines cross the y-axis in
different places. It appears that the outlier (the last point in the data set) has
quite an affect on the best-fitting line.
Figure 4-6 shows the residual plots for the regression line for the data set with-
out the outlier. Each of these plots shows a much better fit of the data to the
model compared to Figure 4-4. This result tells you that the data for grade
twelve is influential in this data set, and that outlier needs to be noted and
perhaps explored further. Do students peak out when they’re juniors in high
school? Or do they just decide when they’re seniors that it isn’t cool to carry
books around? (A statistician’s job isn’t to wonder why, but to do and analyze.)
@Spy