
Page 99 - Intermediate Statistics for Dummies
P. 99
09_045206 ch04.qxd 2/1/07 9:49 AM Page 78
78
Part II: Making Predictions by Using Regression
y
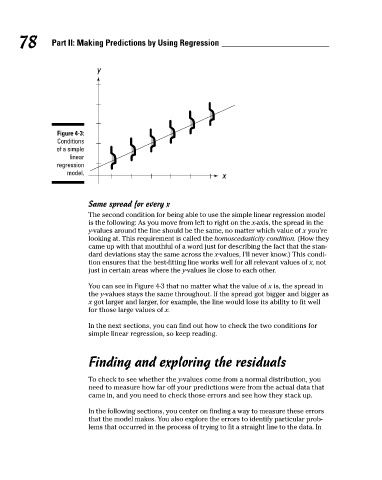
Figure 4-3:
Conditions
of a simple
linear
regression
model.
Same spread for every x x
The second condition for being able to use the simple linear regression model
is the following: As you move from left to right on the x-axis, the spread in the
y-values around the line should be the same, no matter which value of x you’re
looking at. This requirement is called the homoscedasticity condition. (How they
came up with that mouthful of a word just for describing the fact that the stan-
dard deviations stay the same across the x-values, I’ll never know.) This condi-
tion ensures that the best-fitting line works well for all relevant values of x, not
just in certain areas where the y-values lie close to each other.
You can see in Figure 4-3 that no matter what the value of x is, the spread in
the y-values stays the same throughout. If the spread got bigger and bigger as
x got larger and larger, for example, the line would lose its ability to fit well
for those large values of x.
In the next sections, you can find out how to check the two conditions for
simple linear regression, so keep reading.
Finding and exploring the residuals
To check to see whether the y-values come from a normal distribution, you
need to measure how far off your predictions were from the actual data that
came in, and you need to check those errors and see how they stack up.
In the following sections, you center on finding a way to measure these errors
that the model makes. You also explore the errors to identify particular prob-
lems that occurred in the process of trying to fit a straight line to the data. In