Page 199 - Intermediate Statistics for Dummies
P. 199

16_045206 ch10.qxd  2/1/07  10:14 AM  Page 178
                               178
                                         Part III: Comparing Many Means with ANOVA
                                                       Group 3: Adult males 40-59 years old
                                                       Group 4: Adult females 60 years old and over
                                                    You collect data on a random sample of 10 people from each group (where no
                                                    one knows anyone else to keep independence), and you record the number of
                                                    minutes each person used their cell phone in one month. The first ten lines of
                                                    a hypothetical data set are shown in Table 10-1.
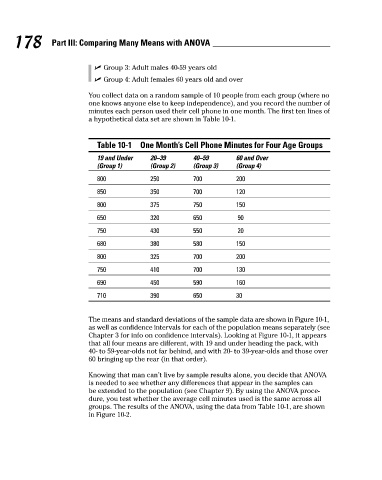
                                                      Table 10-1 One Month’s Cell Phone Minutes for Four Age Groups
                                                      19 and Under
                                                                                 (Group 3)
                                                                                             (Group 4)
                                                      (Group 1)
                                                                     (Group 2)
                                                      800
                                                                     250
                                                                                 700
                                                                                             200
                                                                                             120
                                                                     350
                                                                                 700
                                                      850
                                                      800            20–39       40–59       60 and Over
                                                                                             150
                                                                                 750
                                                                     375
                                                      650            320         650         90
                                                      750            430         550         20
                                                      680            380         580         150
                                                      800            325         700         200
                                                      750            410         700         130
                                                      690            450         590         160
                                                      710            390         650         30
                                                    The means and standard deviations of the sample data are shown in Figure 10-1,
                                                    as well as confidence intervals for each of the population means separately (see
                                                    Chapter 3 for info on confidence intervals). Looking at Figure 10-1, it appears
                                                    that all four means are different, with 19 and under heading the pack, with
                                                    40- to 59-year-olds not far behind, and with 20- to 39-year-olds and those over
                                                    60 bringing up the rear (in that order).
                                                    Knowing that man can’t live by sample results alone, you decide that ANOVA
                                                    is needed to see whether any differences that appear in the samples can
                                                    be extended to the population (see Chapter 9). By using the ANOVA proce-
                                                    dure, you test whether the average cell minutes used is the same across all
                                                    groups. The results of the ANOVA, using the data from Table 10-1, are shown
                                                    in Figure 10-2.
   194   195   196   197   198   199   200   201   202   203   204