Page 203 - Intermediate Statistics for Dummies
P. 203

16_045206 ch10.qxd  2/1/07  10:14 AM  Page 182
                               182
                                         Part III: Comparing Many Means with ANOVA
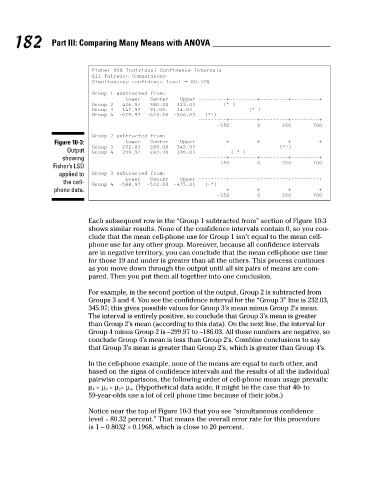
                                                    Fisher 95% Individual Confidence Intervals
                                                    All Pairwise Comparisons
                                                    Simultaneous confidence level = 80.32%
                                                    Group 1 subtracted from:
                                                                     Center
                                                                             Upper –––––––––+–––––––––+–––––––––+–––––––––+
                                                              Lower
                                                                                         (*–)
                                                    Group 2  –436.97  –380.00  –323.03

                                                                                                 (*–)
                                                    Group 3  –147.97  –91.00   –34.03
                                                    Group 4  –679.97  –623.00  –566.03    (*–)
                                                                                  –––––––––+–––––––––+–––––––––+–––––––––+
                                                                                        –350         0       350       700
                                                    Group 2 subtracted from:
                                          Figure 10-3:
                                                                     Center
                                                              Lower
                                                                             Upper –––––––––+–––––––––+–––––––––+–––––––––+
                                                    Group 3
                                                             232.03
                                                                                                           (*–)
                                                                            345.97
                                                                     289.00
                                              Output
                                                                                           (–*–)
                                                    Group 4  –299.97  –243.00  –186.03
                                            showing
                                                                                  –––––––––+–––––––––+–––––––––+–––––––––+
                                                                                        –350         0       350       700
                                          Fisher’s LSD
                                           applied to
                                                    Group 3 subtracted from:
                                                              Lower
                                                                     Center
                                                                             Upper –––––––––+–––––––––+–––––––––+–––––––––+
                                             the cell-
                                                    Group 4  –588.97  –532.00  –475.03    (–*)
                                          phone data.
                                                                                  –––––––––+–––––––––+–––––––––+–––––––––+
                                                                                        –350         0       350       700
                                                    Each subsequent row in the “Group 1 subtracted from” section of Figure 10-3
                                                    shows similar results. None of the confidence intervals contain 0, so you con-
                                                    clude that the mean cell-phone use for Group 1 isn’t equal to the mean cell-
                                                    phone use for any other group. Moreover, because all confidence intervals
                                                    are in negative territory, you can conclude that the mean cell-phone use time
                                                    for those 19 and under is greater than all the others. This process continues
                                                    as you move down through the output until all six pairs of means are com-
                                                    pared. Then you put them all together into one conclusion.
                                                    For example, in the second portion of the output, Group 2 is subtracted from
                                                    Groups 3 and 4. You see the confidence interval for the “Group 3” line is 232.03,
                                                    345.97; this gives possible values for Group 3’s mean minus Group 2’s mean.
                                                    The interval is entirely positive, so conclude that Group 3’s mean is greater
                                                    than Group 2’s mean (according to this data). On the next line, the interval for
                                                    Group 4 minus Group 2 is –299.97 to –186.03. All these numbers are negative, so
                                                    conclude Group 4’s mean is less than Group 2’s. Combine conclusions to say
                                                    that Group 3’s mean is greater than Group 2’s, which is greater than Group 4’s.
                                                    In the cell-phone example, none of the means are equal to each other, and
                                                    based on the signs of confidence intervals and the results of all the individual
                                                    pairwise comparisons, the following order of cell-phone mean usage prevails:
                                                    µ 1 > µ 3 > µ 2 > µ 4 . (Hypothetical data aside, it might be the case that 40- to
                                                    59-year-olds use a lot of cell phone time because of their jobs.)
                                                    Notice near the top of Figure 10-3 that you see “simultaneous confidence
                                                    level = 80.32 percent.” That means the overall error rate for this procedure
                                                    is 1 – 0.8032 = 0.1968, which is close to 20 percent.
   198   199   200   201   202   203   204   205   206   207   208