Page 205 - Intermediate Statistics for Dummies
P. 205

16_045206 ch10.qxd  2/1/07  10:14 AM  Page 184
                               184
                                         Part III: Comparing Many Means with ANOVA
                                                    The results of Fisher and Tukey don’t always agree, usually because the
                                                    overall error rate of Fisher’s procedure is larger than Tukey’s (except
                                                    when only two means are involved). Most statisticians I know prefer Tukey’s
                                                    procedure over Fisher’s. That doesn’t mean they don’t have other procedures
                                                    they like even better than Tukey’s, but Tukey’s is the most common proce-
                                                    dure, and many people like to use it.
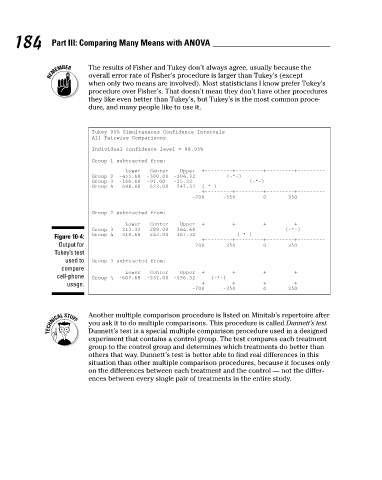
                                                    Tukey 95% Simultaneous Confidence Intervals
                                                    All Pairwise Comparisons
                                                    Individual confidence level = 98.93%
                                                    Group 1 subtracted from:
                                                              Lower
                                                                     Center
                                                                             Upper  +–––––––––+–––––––––+–––––––––+–––––––––
                                                                                          (–*–)
                                                    Group 2  –455.68  –380.00  –304.32
                                                                                                 (–*–)
                                                    Group 3  –166.68  –91.00   –15.32
                                                    Group 4  –698.68  –623.00  –547.32   (–*–)
                                                                                   +–––––––––+–––––––––+–––––––––+–––––––––
                                                    Group 2 subtracted from:          –700      –350         0       350
                                                              Lower  Center  Upper  +–––––––––+–––––––––+–––––––––+–––––––––
                                                    Group 3   213.32   289.00   364.68                         (–*-)
                                          Figure 10-4:  Group 4  –318.68  –243.00  –167.32         (–*–)
                                                                                   +–––––––––+–––––––––+–––––––––+–––––––––
                                           Output for                             –700      –350         0       350
                                          Tukey’s test
                                             used to  Group 3 subtracted from:
                                            compare
                                                              Lower  Center  Upper  +–––––––––+–––––––––+–––––––––+–––––––––
                                           cell-phone  Group 4  –607.68  –532.00  –456.32      (–*–)
                                              usage.                               +–––––––––+–––––––––+–––––––––+–––––––––
                                                                                  –700      –350         0       350
                                                    Another multiple comparison procedure is listed on Minitab’s repertoire after
                                                    you ask it to do multiple comparisons. This procedure is called Dunnett’s test.
                                                    Dunnett’s test is a special multiple comparison procedure used in a designed
                                                    experiment that contains a control group. The test compares each treatment
                                                    group to the control group and determines which treatments do better than
                                                    others that way. Dunnett’s test is better able to find real differences in this
                                                    situation than other multiple comparison procedures, because it focuses only
                                                    on the differences between each treatment and the control — not the differ-
                                                    ences between every single pair of treatments in the entire study.
   200   201   202   203   204   205   206   207   208   209   210