
Page 200 - Intermediate Statistics for Dummies
P. 200
16_045206 ch10.qxd 2/1/07 10:14 AM Page 179
Chapter 10: Pairing Things Down with Multiple Comparisons
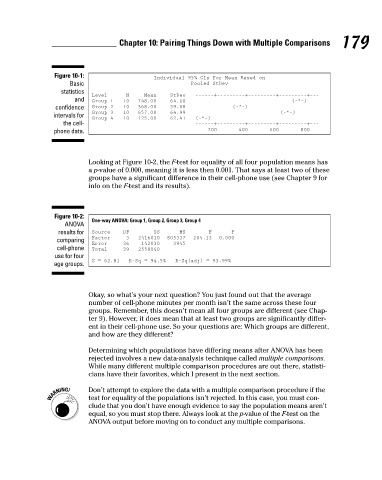
Figure 10-1:
Individual 95% CIs For Mean Based on
Basic
Pooled StDev
statistics
––––––+–––––––––+–––––––––+–––––––––+–––
Mean
N
StDev
Level
and
10
748.00
(–*–)
Group 1
64.60
10
59.08
Group 2
(–*–)
368.00
confidence
64.99
(–*–)
657.00
10
Group 3
intervals for
62.41
10
Group 4
125.00
(–*–)
the cell-
––––––+–––––––––+–––––––––+–––––––––+–––
200 400 600 800
phone data.
a p-value of 0.000, meaning it is less then 0.001. That says at least two of these
groups have a significant difference in their cell-phone use (see Chapter 9 for
info on the F-test and its results).
Figure 10-2: Looking at Figure 10-2, the F-test for equality of all four population means has 179
One-way ANOVA: Group 1, Group 2, Group 3, Group 4
ANOVA
results for Source DF SS MS F P
Factor 3 2416010 805337 204.13 0.000
comparing
Error 36 142030 3945
cell-phone Total 39 2558040
use for four
S = 62.81 R–Sq = 94.5% R–Sq(adj) = 93.99%
age groups.
Okay, so what’s your next question? You just found out that the average
number of cell-phone minutes per month isn’t the same across these four
groups. Remember, this doesn’t mean all four groups are different (see Chap-
ter 9). However, it does mean that at least two groups are significantly differ-
ent in their cell-phone use. So your questions are: Which groups are different,
and how are they different?
Determining which populations have differing means after ANOVA has been
rejected involves a new data-analysis technique called multiple comparisons.
While many different multiple comparison procedures are out there, statisti-
cians have their favorites, which I present in the next section.
Don’t attempt to explore the data with a multiple comparison procedure if the
test for equality of the populations isn’t rejected. In this case, you must con-
clude that you don’t have enough evidence to say the population means aren’t
equal, so you must stop there. Always look at the p-value of the F-test on the
ANOVA output before moving on to conduct any multiple comparisons.