
Page 45 - Intermediate Statistics for Dummies
P. 45
05_045206 ch01.qxd 2/1/07 9:41 AM Page 24
24
Part I: Data Analysis and Model-Building Basics
Interaction effects come up when you have a model that includes two or
more variables, and you’re using those variables to explain differences or to
make comparisons regarding some outcome. When you have two or more
variables in a model, you can’t automatically study the effect of each variable
separately; you also have to take into account the way those variables inter-
act in terms of the outcome. In other words, you have to examine whether or
not an interaction effect is present.
For example, suppose medical researchers are studying a new drug for
depression and want to know how this drug affects the change in blood pres-
sure for a low dose versus a high dose of the drug. They also compare the
effects for children versus adults. In total, the model being studied has one
response variable, an increase in blood pressure, and two factors that may
possibly explain changes in the outcome, namely age group (adults versus
children) and dosage level (low versus high). It could be that dosage level
affects the blood pressure of adults differently than the blood pressure of
children. This type of model is called a two-way ANOVA model, with a possible
interaction effect between the two factors (age group and dosage level). See
Chapter 11 for more.
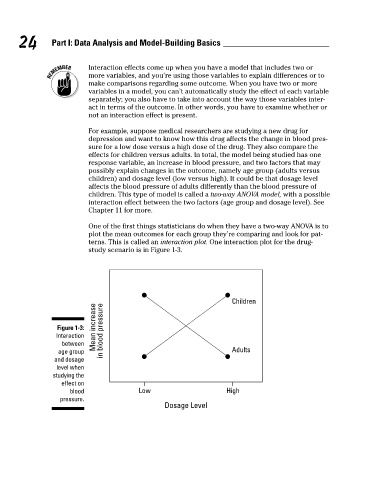
One of the first things statisticians do when they have a two-way ANOVA is to
plot the mean outcomes for each group they’re comparing and look for pat-
terns. This is called an interaction plot. One interaction plot for the drug-
study scenario is in Figure 1-3.
Children
Mean increase
Figure 1-3: in blood pressure
Interaction
between
age group Adults
and dosage
level when
studying the
effect on
blood Low High
pressure.
Dosage Level