
Page 46 - Intermediate Statistics for Dummies
P. 46
05_045206 ch01.qxd 2/1/07 9:41 AM Page 25
Chapter 1: Beyond Number Crunching: The Art and Science of Data Analysis
As you can see by Figure 1-3, the lines cross. If you look at the line represent-
ing children, you can see that the mean increase in blood pressure is low for
the low dose of the drug, but then for the high dose of the drug; the increase
in blood pressure goes way up. Alternatively, the reaction is the exact oppo-
site for adults; on the low dose, the mean increase in blood pressure is very
high, but for the high dose, the increase is very low. If the doctors neglected to
study children as well as adults, the results of this study could be extremely
damaging to children if doctors applied the rules for adults to children. This
example shows that interaction effects are very important to look at.
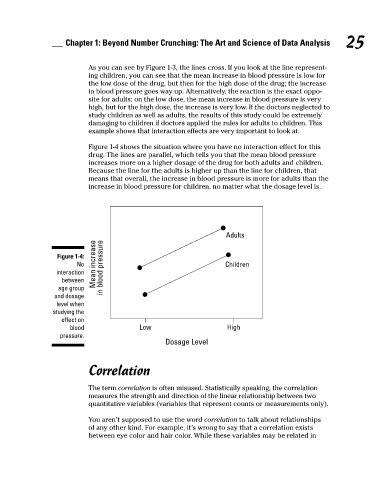
Figure 1-4 shows the situation where you have no interaction effect for this
drug. The lines are parallel, which tells you that the mean blood pressure
increases more on a higher dosage of the drug for both adults and children.
Because the line for the adults is higher up than the line for children, that
means that overall, the increase in blood pressure is more for adults than the
increase in blood pressure for children, no matter what the dosage level is.
Adults 25
Figure 1-4:
No Mean increase in blood pressure Children
interaction
between
age group
and dosage
level when
studying the
effect on
blood Low High
pressure.
Dosage Level
Correlation
The term correlation is often misused. Statistically speaking, the correlation
measures the strength and direction of the linear relationship between two
quantitative variables (variables that represent counts or measurements only).
You aren’t supposed to use the word correlation to talk about relationships
of any other kind. For example, it’s wrong to say that a correlation exists
between eye color and hair color. While these variables may be related in