Page 47 - Intermediate Statistics for Dummies
P. 47

05_045206 ch01.qxd  2/1/07  9:41 AM  Page 26
                                26
                                         Part I: Data Analysis and Model-Building Basics
                                                    some way, they’re not quantitative variables, so you can’t discuss their rela-
                                                    tionship in terms of a correlation. (In this case, you would use the term asso-
                                                    ciation; in Chapter 14, you see how to test for association of two categorical
                                                    variables.)
                                                    The long and short of correlation is the following: Correlation is a number
                                                    between –1.0 and +1.0. Positive one indicates a perfect positive relationship;
                                                    in other words, as you increase one variable, the other one increases in per-
                                                    fect sync. On the other side of the coin, a correlation that is –1.0 indicates a
                                                    perfect negative relationship between the variables. As one variable increases,
                                                    the other one decreases in perfect sync. A correlation of zero indicates that
                                                    you found no linear relationship at all between the variables. Most correla-
                                                    tions in the real world aren’t exactly +1.0, –1.0, or 0 — they fall somewhere in
                                                    between. The closer to +1.0 or –1.0, the stronger the relationship is; the
                                                    closer to 0, the weaker the relationship is.
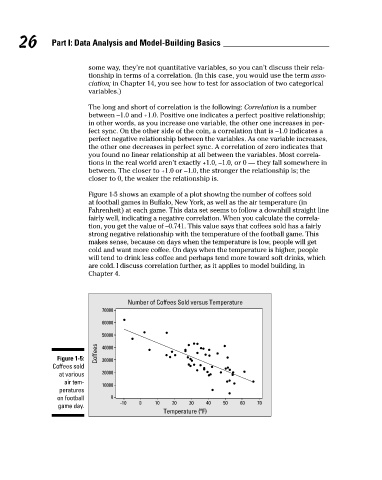
                                                    Figure 1-5 shows an example of a plot showing the number of coffees sold
                                                    at football games in Buffalo, New York, as well as the air temperature (in
                                                    Fahrenheit) at each game. This data set seems to follow a downhill straight line
                                                    fairly well, indicating a negative correlation. When you calculate the correla-
                                                    tion, you get the value of –0.741. This value says that coffees sold has a fairly
                                                    strong negative relationship with the temperature of the football game. This
                                                    makes sense, because on days when the temperature is low, people will get
                                                    cold and want more coffee. On days when the temperature is higher, people
                                                    will tend to drink less coffee and perhaps tend more toward soft drinks, which
                                                    are cold. I discuss correlation further, as it applies to model building, in
                                                    Chapter 4.
                                                              Number of Coffees Sold versus Temperature
                                                       70000
                                                       60000
                                                       50000
                                                      Coffees  40000
                                           Figure 1-5:  30000
                                          Coffees sold
                                           at various  20000
                                             air tem-
                                                       10000
                                           peratures
                                           on football    0
                                                            -10   0   10   20   30  40   50   60   70
                                           game day.
                                                                        Temperature (ºF)
   42   43   44   45   46   47   48   49   50   51   52