
Page 92 - Intermediate Statistics for Dummies
P. 92
09_045206 ch04.qxd 2/1/07 9:49 AM Page 71
Chapter 4: Getting in Line with Simple Linear Regression
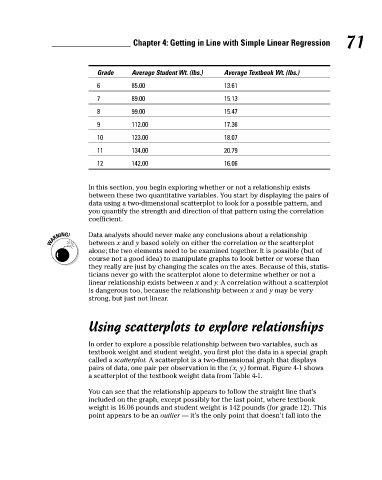
Average Textbook Wt. (lbs.)
Average Student Wt. (lbs.)
Grade
6
13.61
85.00
15.13
89.00
7
99.00
15.47
8
9
17.36
112.00
10
18.07
123.00
20.79
11
134.00
142.00
12
16.06
In this section, you begin exploring whether or not a relationship exists
between these two quantitative variables. You start by displaying the pairs of
data using a two-dimensional scatterplot to look for a possible pattern, and 71
you quantify the strength and direction of that pattern using the correlation
coefficient.
Data analysts should never make any conclusions about a relationship
between x and y based solely on either the correlation or the scatterplot
alone; the two elements need to be examined together. It is possible (but of
course not a good idea) to manipulate graphs to look better or worse than
they really are just by changing the scales on the axes. Because of this, statis-
ticians never go with the scatterplot alone to determine whether or not a
linear relationship exists between x and y. A correlation without a scatterplot
is dangerous too, because the relationship between x and y may be very
strong, but just not linear.
Using scatterplots to explore relationships
In order to explore a possible relationship between two variables, such as
textbook weight and student weight, you first plot the data in a special graph
called a scatterplot. A scatterplot is a two-dimensional graph that displays
pairs of data, one pair per observation in the (x, y) format. Figure 4-1 shows
a scatterplot of the textbook weight data from Table 4-1.
You can see that the relationship appears to follow the straight line that’s
included on the graph, except possibly for the last point, where textbook
weight is 16.06 pounds and student weight is 142 pounds (for grade 12). This
point appears to be an outlier — it’s the only point that doesn’t fall into the