
Page 91 - Intermediate Statistics for Dummies
P. 91
09_045206 ch04.qxd 2/1/07 9:49 AM Page 70
70
Part II: Making Predictions by Using Regression
Exploring Relationships with
Scatterplots and Correlations
Before looking ahead to predicting a value of y by using a value of x, you
need to first establish that you have a legitimate reason to do so by using a
straight line, and you also need to feel confident that using a line to make that
prediction will actually work well. In order to achieve both of these important
steps, you need to first plot the data in a pairwise fashion so you can visually
look for a relationship; then you need to somehow quantify that relationship
in terms of how well those points follow a line. In this section, you do just
that, using scatterplots and correlations.
Here’s a perfect example of a situation where simple linear regression is useful:
In 2004, the California State Board of Education wrote a report entitled “Text-
book Weight in California: Analysis and Recommendations.” In this report, they
discussed the great concern over the weight of the textbooks in student’s back-
packs, and the problems it presents for students. They conducted a study
where they weighed a variety of textbooks from each of four core areas studied
in grades 1 through 12 (reading, math, science, and history — where’s statis-
tics?) over a range of textbook brands and found the average total weight for
all four books for each grade.
The California Board of Education consulted pediatricians and chiropractors,
who recommended that the weight of a student’s backpack should not
exceed 15 percent of his body weight. From there, the Board hypothesized
that the total weight of the textbooks in these four areas increases for each
grade level and wanted to see whether they could find a relationship between
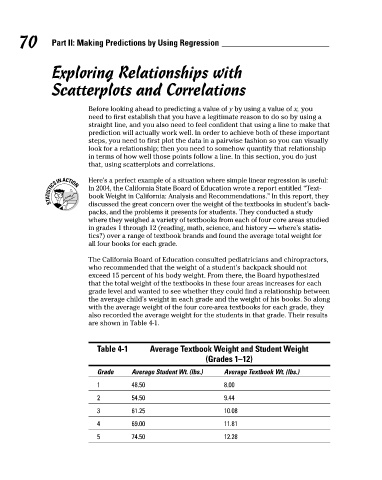
the average child’s weight in each grade and the weight of his books. So along
with the average weight of the four core-area textbooks for each grade, they
also recorded the average weight for the students in that grade. Their results
are shown in Table 4-1.
Table 4-1 Average Textbook Weight and Student Weight
(Grades 1–12)
Grade Average Student Wt. (lbs.) Average Textbook Wt. (lbs.)
1 48.50 8.00
2 54.50 9.44
3 61.25 10.08
4 69.00 11.81
5 74.50 12.28