
Page 246 - Introduction to AI Robotics
P. 246
6.6 Computer Vision
a. b. 229
c.
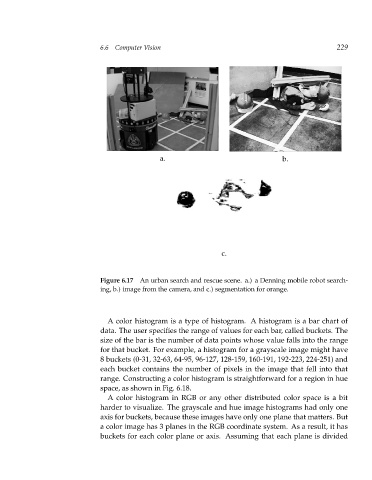
Figure 6.17 An urban search and rescue scene. a.) a Denning mobile robot search-
ing, b.) image from the camera, and c.) segmentation for orange.
A color histogram is a type of histogram. A histogram is a bar chart of
data. The user specifies the range of values for each bar, called buckets. The
size of the bar is the number of data points whose value falls into the range
for that bucket. For example, a histogram for a grayscale image might have
8 buckets (0-31, 32-63, 64-95, 96-127, 128-159, 160-191, 192-223, 224-251) and
each bucket contains the number of pixels in the image that fell into that
range. Constructing a color histogram is straightforward for a region in hue
space, as shown in Fig. 6.18.
A color histogram in RGB or any other distributed color space is a bit
harder to visualize. The grayscale and hue image histograms had only one
axis for buckets, because these images have only one plane that matters. But
a color image has 3 planes in the RGB coordinate system. As a result, it has
buckets for each color plane or axis. Assuming that each plane is divided