
Page 39 - Introduction to Colloid and Surface Chemistry
P. 39
30 Kinetic properties
f» 2500s
/ - 400 s
t- 100s
C
0 0
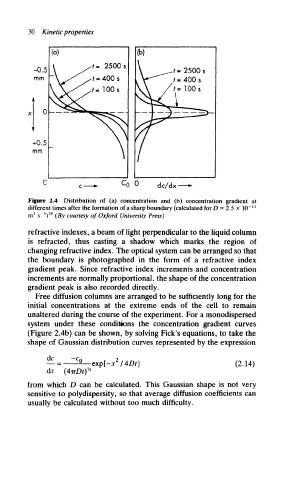
Figure 2.4 Distribution of (a) concentration and (b) concentration gradient at
different times after the formation of a sharp boundary (calculated for D = 2.5 x 10~''
2
!
8
m s )" (By courtesy of Oxford University Press)
refractive indexes, a beam of light perpendicular to the liquid column
is refracted, thus casting a shadow which marks the region of
changing refractive index. The optical system can be arranged so that
the boundary is photographed in the form of a refractive index
gradient peak. Since refractive index increments and concentration
increments are normally proportional, the shape of the concentration
gradient peak is also recorded directly.
Free diffusion columns are arranged to be sufficiently long for the
initial concentrations at the extreme ends of the cell to remain
unaltered during the course of the experiment. For a monodispersed
system under these conditions the concentration gradient curves
(Figure 2.4b) can be shown, by solving Pick's equations, to take the
shape of Gaussian distribution curves represented by the expression
dc
-exp[-* /4Dt] (2.14)
dx
from which D can be calculated. This Gaussian shape is not very
sensitive to polydispersity, so that average diffusion coefficients can
usually be calculated without too much difficulty.