
Page 117 - Introduction to Information Optics
P. 117
2. Signal Processing with Optics
_'£ZL 1 0 2ir g
a a
1 2it
r b ^
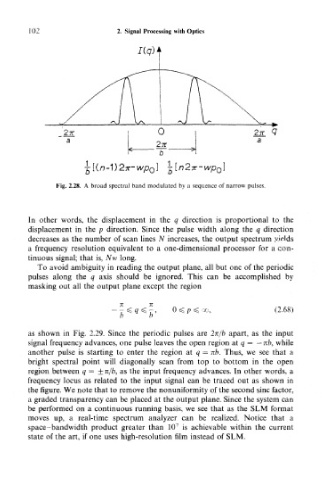
Fig. 2.28. A broad spectral band modulated by a sequence of narrow pulses.
In other words, the displacement in the q direction is proportional to the
displacement in the p direction. Since the pulse width along the q direction
decreases as the number of scan lines N increases, the output spectrum yields
a frequency resolution equivalent to a one-dimensional processor for a con-
tinuous signal; that is, Nw long.
To avoid ambiguity in reading the output plane, all but one of the periodic
pulses along the q axis should be ignored. This can be accomplished by
masking out all the output plane except the region
T j- (2.68)
b b
as shown in Fig. 2.29. Since the periodic pulses are 2n/b apart, as the input
signal frequency advances, one pulse leaves the open region at q = — rib, while
another pulse is starting to enter the region at q = nb. Thus, we see that a
bright spectral point will diagonally scan from top to bottom in the open
region between q = ± n/b, as the input frequency advances. In other words, a
frequency locus as related to the input signal can be traced out as shown in
the figure. We note that to remove the nonuniformity of the second sine factor,
a graded transparency can be placed at the output plane. Since the system can
be performed on a continuous running basis, we see that as the SLM format
moves up, a real-time spectrum analyzer can be realized. Notice that a
7
space-band width product greater than 10 is achievable within the current
state of the art, if one uses high-resolution film instead of SLM.