
Page 396 - Introduction to Information Optics
P. 396
7.4. Target Tracking
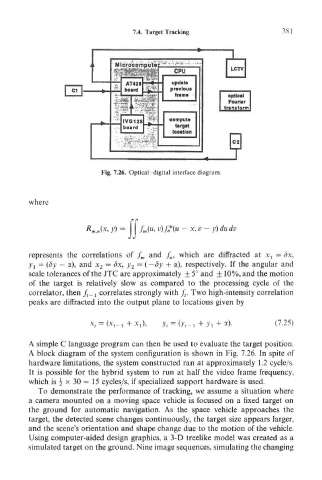
Fig. 7.26. Optical digital interface diagram.
where
represents the correlations of f m and /„, which are diffracted at jq = <5x,
;
J i — (<5y — #), an d x 2 = <5x, y 2 = ( — dy + a), respectively. If the angular and
scale tolerances of the JTC are approximately ± 5° and +10%, and the motion
of the target is relatively slow as compared to the processing cycle of the
correlator, then f t_± correlates strongly with /,. Two high-intensity correlation
peaks are diffracted into the output plane to locations given by
x t = (x,_ ! + x,), y t = (y t_ , + v, + a). (7.25)
A simple C language program can then be used to evaluate the target position.
A block diagram of the system configuration is shown in Fig. 7.26. In spite of
hardware limitations, the system constructed ran at approximately 1.2 cycle/s.
It is possible for the hybrid system to run at half the video frame frequency,
which is \ x 30 = 15 cycles/s, if specialized support hardware is used.
To demonstrate the performance of tracking, we assume a situation where
a camera mounted on a moving space vehicle is focused on a fixed target on
the ground for automatic navigation. As the space vehicle approaches the
target, the detected scene changes continuously, the target size appears larger,
and the scene's orientation and shape change due to the motion of the vehicle.
Using computer-aided design graphics, a 3-D treelike model was created as a
simulated target on the ground. Nine image sequences, simulating the changing