
Page 415 - Introduction to Information Optics
P. 415
7. Pattern Recognition with Optics
1*11 P*12
1*21
PC,
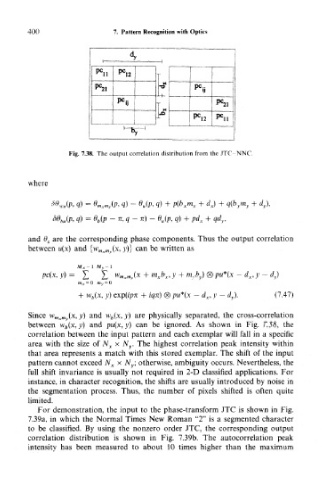
Fig. 7.38. The output correlation distribution from the JTC-NNC.
where
M*u(P, q) = Qm xm y(P* Q) - 6 U(P> 4) + P(b xm x + d x] + q(b ym y + d y\
dB bu(p, q) = O b(p - TT, q - n) - 0 u(p, q) + pd x + qd y,
and 9 S are the corresponding phase components. Thus the output correlation
between u(x) and {w mxiny(x, y)} can be written as
y
pc(x, y) = Z Z w >n xm y(x + m xb x,y + m yb y) (g) pu*(x - rf x, j' - ^,)
m x = 0 m y — 0
+ w b(x, y) TT + iqn) (x) pw*(x — d x, y — rf y). (7.47)
Since w mxMy(x, y) and w b(x, y) are physically separated, the cross-correlation
between w b(x, y) and pu(x, y) can be ignored. As shown in Fig. 7.38, the
correlation between the input pattern and each exemplar will fall in a specific
area with the size of N x x N y. The highest correlation peak intensity within
that area represents a match with this stored exemplar. The shift of the input
pattern cannot exceed N x x N y; otherwise, ambiguity occurs. Nevertheless, the
full shift invariance is usually not required in 2-D classified applications. For
instance, in character recognition, the shifts are usually introduced by noise in
the segmentation process. Thus, the number of pixels shifted is often quite
limited.
For demonstration, the input to the phase-transform JTC is shown in Fig.
7.39a, in which the Normal Times New Roman "2" is a segmented character
to be classified. By using the nonzero order JTC, the corresponding output
correlation distribution is shown in Fig. 7.39b. The autocorrelation peak
intensity has been measured to about 10 times higher than the maximum