
Page 692 - Introduction to Information Optics
P. 692
12. Networking with Optics
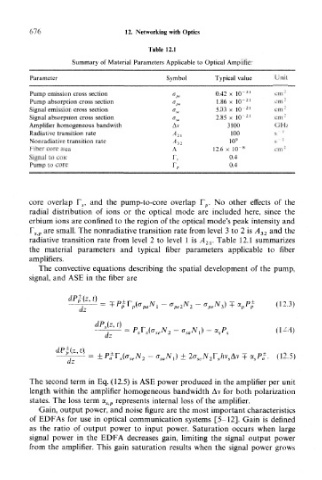
Table 12.1
Summary of Material Parameters Applicable to Optical Amplifier
Parameter Symbol Typical value Unit
Pump emission cross section V 0.42 x 10" 21 Cttl~"
Pump absorption cross section <v 1.86 x 10~ 21 cm 2
Signal emission cross section f,e 5.03 x 10" 21 cm 2
Signal absorption cross section a sa 2.85 x 10~ 21 cm "'
Amplifier homogeneous bandwith Av 3100 GHz
Radiative transition rate A 2l 100 s'" 1
Nonradiative transition rate ^32 10 9 8
Fiber core area A 12.6 x 10" 8 cm 2
Signal to core r, 0.4
Pump to core r. 0.4
core overlap F s, and the pump-to-core overlap F p. No other effects of the
radial distribution of ions or the optical mode are included here, since the
erbium ions are confined to the region of the optical mode's peak intensity and
F s p are small. The nonradiative transition rate from level 3 to 2 is A 32 and the
radiative transition rate from level 2 to level 1 is A 2l. Table 12.1 summarizes
the material parameters and typical fiber parameters applicable to fiber
amplifiers.
The convective equations describing the spatial development of the pump,
signal, and ASE in the fiber are
dP}(z, t)
P
= +P£r p(<T paN l <7 De W 3 ) + %» c (12.3)
dz
dP s(z, t)
(12.4)
dz
± 2a seN 2r shv sAv (12.5)
d
The second term in Eq. (12.5) is ASE power produced in the amplifier per unit
length within the amplifier homogeneous bandwidth Av for both polarization
states. The loss term a s p represents internal loss of the amplifier.
Gain, output power, and noise figure are the most important characteristics
of EDFAs for use in optical communication systems [5-12]. Gain is defined
as the ratio of output power to input power. Saturation occurs when large
signal power in the EDFA decreases gain, limiting the signal output power
from the amplifier. This gain saturation results when the signal power grows