Page 693 - Introduction to Information Optics
P. 693
12.2. Optical Network Elements            677
       large and causes stimulated emission at such a high rate that the inversion is
       decreased; that is, the number of excited erbium ions decreases substantially.
       The output signal power is limited only by available pump power. Heavily
       saturated amplifiers can convert pump photons to signal photons with efficien-
       cies exceeding 90%.
         An optical amplifier always degrades the signal by adding noise from
       amplified spontaneous noise (ASE), which arises from amplified light produced
       by spontaneous emission from erbium ions [13]. Noise figure is defined as the
       input signal-to-noise ratio (SNR) divided by the output signal-to-noise ratio,
       when the input signal is shot noise limited. Shot noise represents the deviation
       from ideal current, which is caused by random generation of discrete charge
       carriers. In semiconductor photodiodes, shot noise arises from random gener-
       ation and recombination of the free electrons and holes. Shot noise-limited
       optical signal in essence means pure optical sine wave as any photodiode can
       tell. As in any communication system, noise is measured within certain
       bandwidths. So in practical terms, noise figure is defined as the ratio of input
       and output SNR's of ideal optoelectronic receivers in an infinitesimally optical
       bandwidth. As the optical bandwidth tends to zero, the contribution from
       spontaneous-spontaneous beat noise diminishes, leaving just the signal-spon-
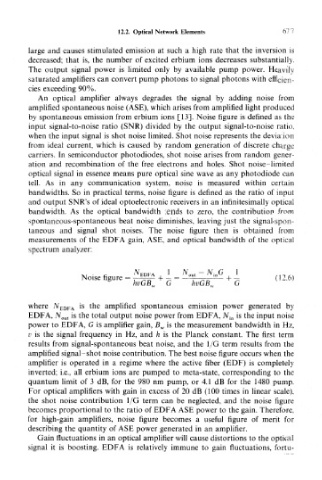
       taneous and signal shot noises. The noise figure then is obtained from
       measurements of the EDFA gain, ASE, and optical bandwidth of the optical
       spectrum analyzer:


       where N EDFA is the amplified spontaneous emission power generated by
       EDFA. N oui is the total output noise power from EDFA, N in is the input noise
       power to EDFA, G is amplifier gain, B w is the measurement bandwidth in Hz,
       v is the signal frequency in Hz, and h is the Planck constant. The first term
       results from signal-spontaneous beat noise, and the 1/G term results from the
       amplified signal -shot noise contribution. The best noise figure occurs when the
       amplifier is operated in a regime where the active fiber (EDF) is completely
       inverted; i.e., all erbium ions are pumped to meta-state, corresponding to the
       quantum limit of 3 dB, for the 980 nm pump, or 4.1 dB for the 1480 pump.
       For optical amplifiers with gain in excess of 20 dB (100 times in linear scale),
       the shot noise contribution 1/G term can be neglected, and the noise figure
       becomes proportional to the ratio of EDFA ASE power to the gain. Therefore.
       for high-gain amplifiers, noise figure becomes a useful figure of merit for
       describing the quantity of ASE power generated in an amplifier.
         Gain fluctuations in an optical amplifier will cause distortions to the optical
       signal it is boosting. EDFA is relatively immune to gain fluctuations, fortu-

