
Page 106 - Introduction to Mineral Exploration
P. 106
5: FROM PROSPECT TO PREFEASIBILITY 89
(c) N KD55 KD16 KD57 KD20 S sign for progress or the use of casing. Besides
detailed core logs, down hole geophysical log-
0 KD72 ging (see section 7.14) is often used and arrange-
KD136 KD19 ments should be made with contractors for
KD75
KD77
timely logging as holes can become rapidly
Depth (m) 50 KD69 KD11 blocked and cleaning of holes is an expensive
KD2
undertaking.
Data on mineralisation, the lithologies,
KD21
11/35 7/34 and structures hosting it should be recorded
3/34
12/10
100 2/46 and plotted on to a graphic log as soon as
8/18
the information becomes available. Initially,
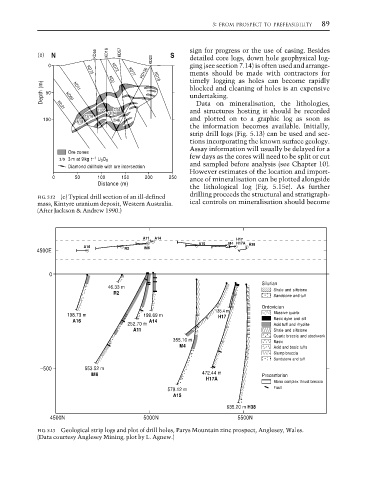
strip drill logs (Fig. 5.13) can be used and sec-
tions incorporating the known surface geology.
Assay information will usually be delayed for a
Ore zones
few days as the cores will need to be split or cut
3/9 3m at 9 kg t –1 U 3 O 8
Diamond drillhole with ore intersection and sampled before analysis (see Chapter 10).
However estimates of the location and import-
0 50 100 150 200 250 ance of mineralisation can be plotted alongside
Distance (m)
the lithological log (Fig. 5.15e). As further
FIG. 5.12 (c) Typical drill section of an ill-defined drilling proceeds the structural and stratigraph-
mass, Kintyre uranium deposit, Western Australia. ical controls on mineralisation should become
(After Jackson & Andrew 1990.)
A11 A14 H17
A15 M4 H17A H38
A16 IM6
4500E R2
0
Silurian
46.33 m Shale and siltstone
R2
Sandstone and tuff
Ordovician
135.4 m
198.73 m 199.69 m H17 Massive quartz
A16 A14 Basic dyke and sill
252.70 m Acid tuff and rhyolite
A11 Shale and siltstone
Quartz breccia and stockwork
355.10 m
Basic
M4 Acid and basic tuffs
Slump breccia
Sandstone and tuff
–500 553.52 m
IM6 472.44 m Precambrian
H17A
Mona complex thrust breccia
579.12 m Fault
A15
635.20 m H38
4500N 5000N 5500N
FIG. 5.13 Geological strip logs and plot of drill holes, Parys Mountain zinc prospect, Anglesey, Wales.
(Data courtesy Anglesey Mining, plot by L. Agnew.)