
Page 107 - Introduction to Mineral Exploration
P. 107
90 C.J. MOON & M.K.G. WHATELEY
clearer. Ambiguities concerned with the inter-
pretation of drilling are common and often 905 m
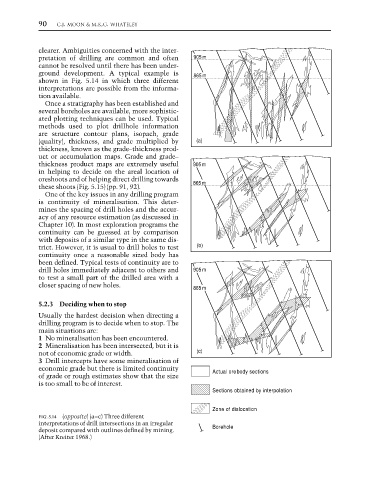
cannot be resolved until there has been under-
ground development. A typical example is 865 m
shown in Fig. 5.14 in which three different
interpretations are possible from the informa-
tion available.
Once a stratigraphy has been established and
several boreholes are available, more sophistic-
ated plotting techniques can be used. Typical
methods used to plot drillhole information
are structure contour plans, isopach, grade
(quality), thickness, and grade multiplied by (a)
thickness, known as the grade–thickness prod-
uct or accumulation maps. Grade and grade–
thickness product maps are extremely useful 905 m
in helping to decide on the areal location of
oreshoots and of helping direct drilling towards
these shoots (Fig. 5.15) (pp. 91, 92). 865 m
One of the key issues in any drilling program
is continuity of mineralisation. This deter-
mines the spacing of drill holes and the accur-
acy of any resource estimation (as discussed in
Chapter 10). In most exploration programs the
continuity can be guessed at by comparison
with deposits of a similar type in the same dis-
trict. However, it is usual to drill holes to test (b)
continuity once a reasonable sized body has
been defined. Typical tests of continuity are to
drill holes immediately adjacent to others and 905 m
to test a small part of the drilled area with a
closer spacing of new holes.
865 m
5.2.3 Deciding when to stop
Usually the hardest decision when directing a
drilling program is to decide when to stop. The
main situations are:
1 No mineralisation has been encountered.
2 Mineralisation has been intersected, but it is
not of economic grade or width. (c)
3 Drill intercepts have some mineralisation of
economic grade but there is limited continuity Actual orebody sections
of grade or rough estimates show that the size
is too small to be of interest.
Sections obtained by interpolation
Zone of dislocation
FIG. 5.14 (opposite) (a–c) Three different
interpretations of drill intersections in an irregular Borehole
deposit compared with outlines defined by mining.
(After Kreiter 1968.)