
Page 108 - Introduction to Mineral Exploration
P. 108
5: FROM PROSPECT TO PREFEASIBILITY 91
18,500N
(a) (b)
IV59 IV103
IV58
IV55
IV54 IV56
IV53 IV102
IV47 IV52 18,250N
N IV46 IV101 N
IV45
IV40 IV44
18,500N IV39
IV38 IV117
IV60 IV37 2200
IV35 18,000N 2150
IV34 IV12 2100
IV33 IV11 IV147 2050 2000
IV9 IV10
IV31 IV61 IV36 IV51 1950
IV30 IV29 IV8 IV7 IV107 IV116 1900
IV5 IV108
IV13 IV32 IV6 17,750N
IV27 IV50 IV126
Section IV14 IV4 IV106 IV114 IV115
18,000N 18000N IV1 IV3 IV49 IV113 IV125
IV43 IV28 IV2 IV123 IV124
IV17 IV42 IV105
IV41 IV11 IV112 17,500N
IV16 IV104 IV127
IV15 1 IV121 IV122
IV20 IV62 IV119 IV110
IV19 IV134 IV118 IV120 IV148 IV140
IV133
IV18 IV128
IV135 IV132 IV130 17,250N
IV129
IV138
IV146 IV149 IV131
17,500N IV139
IV141 IV136
IV142 IV137
17,000N
IV143
IV144
IV145
(d)
18,500N
18,500N
(c)
20 N
22.5
18,250N 25
N 27.5
18,000N
18,000N 30
32.5
17,750N
>150 m%
17,500N
35 100 – 150 m%
17,500N 50 – 100 m%
10 – 50 m%
4 – 10 m%
17,250N
11,500E 12,000E 12,500E
17,000N
11,500E 11,750E 12,000E 12,250E
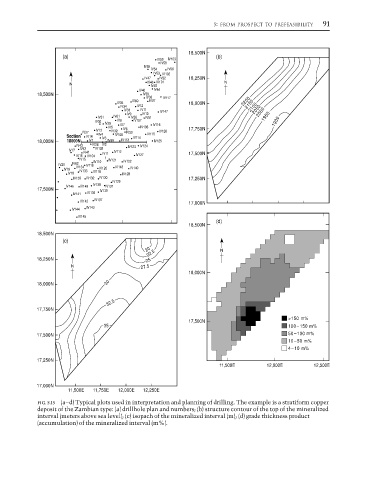
FIG. 5.15 (a–d) Typical plots used in interpretation and planning of drilling. The example is a stratiform copper
deposit of the Zambian type: (a) drillhole plan and numbers; (b) structure contour of the top of the mineralized
interval (meters above sea level); (c) isopach of the mineralized interval (m); (d) grade thickness product
(accumulation) of the mineralized interval (m%).