
Page 197 - Introduction to Mineral Exploration
P. 197
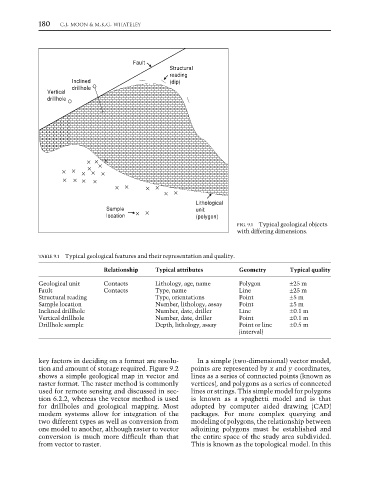
180   C.J. MOON & M.K.G. WHATELEY


                                             Fault
                                                        Structural
                                                        reading
                            Inclined                    (dip)
                            drillhole
                    Vertical
                    drillhole


                                                                Lithological
                                      Sample                    unit
                                      location                  (polygon)
                                                                            FIG. 9.1  Typical geological objects
                                                                            with differing dimensions.


                  TABLE 9.1  Typical geological features and their representation and quality.
                                     Relationship   Typical attributes      Geometry       Typical quality
                  Geological unit    Contacts       Lithology, age, name    Polygon        ±25 m
                  Fault              Contacts       Type, name              Line           ±25 m
                  Structural reading                Type, orientations      Point          ±5m
                  Sample location                   Number, lithology, assay  Point        ±5m
                  Inclined drillhole                Number, date, driller   Line           ±0.1 m
                  Vertical drillhole                Number, date, driller   Point          ±0.1 m
                  Drillhole sample                  Depth, lithology, assay  Point or line  ±0.5 m
                                                                            (interval)


                  key factors in deciding on a format are resolu-  In a simple (two-dimensional) vector model,
                  tion and amount of storage required. Figure 9.2  points are represented by x and y coordinates,
                  shows a simple geological map in vector and  lines as a series of connected points (known as
                  raster format. The raster method is commonly  vertices), and polygons as a series of connected
                  used for remote sensing and discussed in sec-  lines or strings. This simple model for polygons
                  tion 6.2.2, whereas the vector method is used  is known as a spaghetti model and is that
                  for drillholes and geological mapping. Most  adopted by computer aided drawing (CAD)
                  modern systems allow for integration of the  packages. For more complex querying and
                  two different types as well as conversion from  modeling of polygons, the relationship between
                  one model to another, although raster to vector  adjoining polygons must be established and
                  conversion is much more difficult than that  the entire space of the study area subdivided.
                  from vector to raster.                      This is known as the topological model. In this