
Page 85 - Introduction to Paleobiology and The Fossil Record
P. 85
72 INTRODUCTION TO PALEOBIOLOGY AND THE FOSSIL RECORD
So, paleontologists could breathe a sigh of
1 100
relief: their studies of the Cambrian might be
just as well, or badly, supported by data as
0.8 80
their studies of the Carboniferous or Ceno-
SCI
zoic. Or could they? What exactly was being
SCI mean ( ) GER mean ( ) 0.6 GER 60 RCI mean ( ) measured here, the fossil record or reality?
0.4
40
0.2 20 Preservation bias or common cause?
Many paleontologists have noticed a close
RCI
linkage between the rock record and the fossil
0 0 record. Some time intervals, for example,
Pz Pz/Mz Mz Mz/Cz Cz
appear to be represented by thick successions
ancient recent of sedimentary rocks that are bursting with
Partition
fossils, and so the paleontological record of
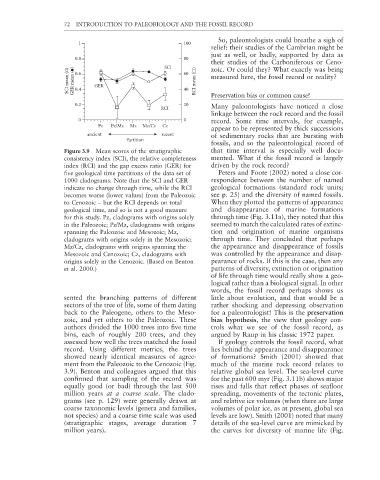
Figure 3.9 Mean scores of the stratigraphic that time interval is especially well docu-
consistency index (SCI), the relative completeness mented. What if the fossil record is largely
index (RCI) and the gap excess ratio (GER) for driven by the rock record?
five geological time partitions of the data set of Peters and Foote (2002) noted a close cor-
1000 cladograms. Note that the SCI and GER respondence between the number of named
indicate no change through time, while the RCI geological formations (standard rock units;
becomes worse (lower values) from the Paleozoic see p. 25) and the diversity of named fossils.
to Cenozoic – but the RCI depends on total When they plotted the patterns of appearance
geological time, and so is not a good measure and disappearance of marine formations
for this study. Pz, cladograms with origins solely through time (Fig. 3.11a), they noted that this
in the Paleozoic; Pz/Mz, cladograms with origins seemed to match the calculated rates of extinc-
spanning the Paleozoic and Mesozoic; Mz, tion and origination of marine organisms
cladograms with origins solely in the Mesozoic; through time. They concluded that perhaps
Mz/Cz, cladograms with origins spanning the the appearance and disappearance of fossils
Mesozoic and Cenozoic; Cz, cladograms with was controlled by the appearance and disap-
origins solely in the Cenozoic. (Based on Benton pearance of rocks. If this is the case, then any
et al. 2000.) patterns of diversity, extinction or origination
of life through time would really show a geo-
logical rather than a biological signal. In other
words, the fossil record perhaps shows us
sented the branching patterns of different little about evolution, and that would be a
sectors of the tree of life, some of them dating rather shocking and depressing observation
back to the Paleogene, others to the Meso- for a paleontologist! This is the preservation
zoic, and yet others to the Paleozoic. These bias hypothesis, the view that geology con-
authors divided the 1000 trees into fi ve time trols what we see of the fossil record, as
bins, each of roughly 200 trees, and they argued by Raup in his classic 1972 paper.
assessed how well the trees matched the fossil If geology controls the fossil record, what
record. Using different metrics, the trees lies behind the appearance and disappearance
showed nearly identical measures of agree- of formations? Smith (2001) showed that
ment from the Paleozoic to the Cenozoic (Fig. much of the marine rock record relates to
3.9). Benton and colleagues argued that this relative global sea level. The sea-level curve
confirmed that sampling of the record was for the past 600 myr (Fig. 3.11b) shows major
equally good (or bad) through the last 500 rises and falls that reflect phases of seafl oor
million years at a coarse scale. The clado- spreading, movements of the tectonic plates,
grams (see p. 129) were generally drawn at and relative ice volumes (when there are large
coarse taxonomic levels (genera and families, volumes of polar ice, as at present, global sea
not species) and a coarse time scale was used levels are low). Smith (2001) noted that many
(stratigraphic stages, average duration 7 details of the sea-level curve are mimicked by
million years). the curves for diversity of marine life (Fig.