Page 87 - Introduction to Paleobiology and The Fossil Record
P. 87

74  INTRODUCTION TO PALEOBIOLOGY AND THE FOSSIL RECORD


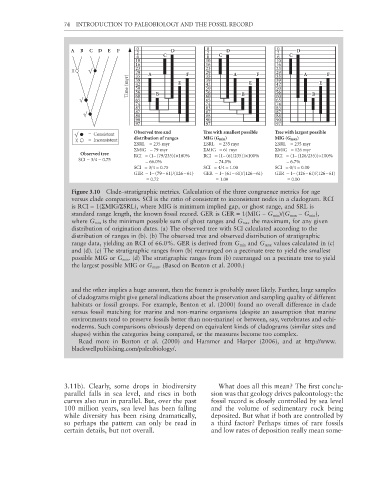
                        A  B  C  D  E  F      0          D           0     D                0     D
                                              2                      2                      2
                                              6       C              6   C                  6   C
                                             10                     10                     10
                                             16                     16                     16
                                             23                     23                     23
                                             29  A            F     29       A       F     29       A       F
                                                                    35
                                                                                           35
                                             35
                                           Time (myr)  39  E        39            E        39            E
                                             42
                                                                    42
                                                                                           42
                                             50
                                                                    50
                                                                                           50
                                             56
                                                                                           56
                                                                    56
                                             60
                                                                                           65
                                                                    65
                                             65     B               60          B          60          B
                                             74                     74                     74
                                             83                     83                     83
                                             87                     87                     87
                                             88                     88                     88
                                             90                     90                     90
                                             97                     97                     97
                              =  Consistent  Observed tree and     Tree with smallest possible  Tree with largest possible
                                             distribution of ranges  MIG (G min)           MIG (G max)
                              =  Inconsistent
                                             ΣSRL    = 235 myr     ΣSRL    = 235 myr       ΣSRL    = 235 myr
                                             ΣMIG   = 79 myr       ΣMIG   = 61 myr         ΣMIG   = 126 myr
                           Observed tree
                                             RCI   = (1– (79/235))×100%  RCI   = (1– (61/235))×100%  RCI   = (1– (126/235))×100%
                           SCI = 3/4 = 0.75            = 66.0%               = 74.0%                 = 6.7%
                                             SCI   = 3/4 = 0.75    SCI   = 4/4 = 1.00      SCI   = 0/4 = 0.00
                                             GER  = 1– (79 – 61)/(126 – 61)  GER  = 1– (61 – 61)/(126 – 61)  GER  = 1– (126 – 61)/(126 – 61)
                                                        = 0.72                = 1.00                  = 0.00
                        Figure 3.10  Clade–stratigraphic metrics. Calculation of the three congruence metrics for age
                        versus clade comparisons. SCI is the ratio of consistent to inconsistent nodes in a cladogram. RCI
                        is RCI = 1(ΣMIG/ΣSRL), where MIG is minimum implied gap, or ghost range, and SRL is
                        standard range length, the known fossil record. GER is GER = 1(MIG − G min )/(G max  − G min ),
                        where G min  is the minimum possible sum of ghost ranges and G max  the maximum, for any given
                        distribution of origination dates. (a) The observed tree with SCI calculated according to the
                        distribution of ranges in (b). (b) The observed tree and observed distribution of stratigraphic
                        range data, yielding an RCI of 66.0%. GER is derived from G min  and G max  values calculated in (c)
                        and (d). (c) The stratigraphic ranges from (b) rearranged on a pectinate tree to yield the smallest
                        possible MIG or G min . (d) The stratigraphic ranges from (b) rearranged on a pectinate tree to yield
                        the largest possible MIG or G max . (Based on Benton et al. 2000.)
                        and the other implies a huge amount, then the former is probably more likely. Further, large samples
                        of cladograms might give general indications about the preservation and sampling quality of different
                        habitats or fossil groups. For example, Benton et al. (2000) found no overall difference in clade
                        versus fossil matching for marine and non-marine organisms (despite an assumption that marine
                        environments tend to preserve fossils better than non-marine) or between, say, vertebrates and echi-
                        noderms. Such comparisons obviously depend on equivalent kinds of cladograms (similar sizes and
                        shapes) within the categories being compared, or the measures become too complex.
                           Read more in Benton et al. (2000) and Hammer and Harper (2006), and at http://www.
                        blackwellpublishing.com/paleobiology/.


                      3.11b). Clearly, some drops in biodiversity       What does all this mean? The fi rst conclu-
                      parallel falls in sea level, and rises in both   sion was that geology drives paleontology: the
                      curves also run in parallel. But, over the past   fossil record is closely controlled by sea level
                      100 million years, sea level has been falling   and the volume of sedimentary rock being
                      while diversity has been rising dramatically,   deposited. But what if both are controlled by
                      so perhaps the pattern can only be read in      a third factor? Perhaps times of rare fossils
                      certain details, but not overall.               and low rates of deposition really mean some-
   82   83   84   85   86   87   88   89   90   91   92