
Page 86 - Introduction to Paleobiology and The Fossil Record
P. 86
TAPHONOMY AND THE QUALITY OF THE FOSSIL RECORD 73
Box 3.3 Clade–stratigraphic metrics
Paleontologists have two sources of data about the history of life: the fossils in the rocks and evolu-
tionary trees. If the evolutionary trees are produced using analytic approaches either from molecular
or morphological data (see pp. 129–33), there should be no direct linkage between the ages of fossils
and the shape of the tree. If that is so, then it should be useful to compare the congruence (or agree-
ment) of fossil sequences and phylogenetic trees. If they agree, then perhaps they are both telling the
correct story; if they are not congruent, then the fossils, or the tree, or both, could be telling us the
wrong story.
There are a variety of metrics for comparing phylogenies and fossil records. The simplest is the
Spearman rank correlation coefficient (SRC). This is a non-parametric measure that simply compares
the order of two series of numbers: if the order is similar enough, the correlation coefficient is sta-
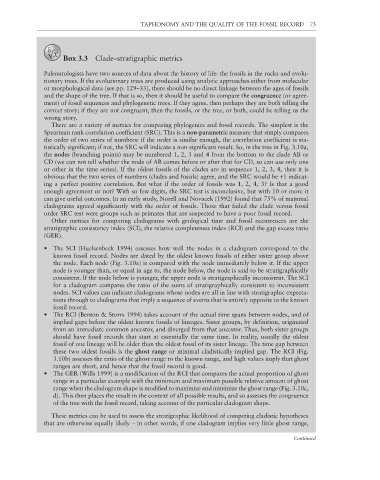
tistically significant; if not, the SRC will indicate a non-significant result. So, in the tree in Fig. 3.10a,
the nodes (branching points) may be numbered 1, 2, 3 and 4 from the bottom to the clade AB or
CD (we can not tell whether the node of AB comes before or after that for CD, so can use only one
or other in the time series). If the oldest fossils of the clades are in sequence 1, 2, 3, 4, then it is
obvious that the two series of numbers (clades and fossils) agree, and the SRC would be +1 indicat-
ing a perfect positive correlation. But what if the order of fossils was 1, 2, 4, 3? Is that a good
enough agreement or not? With so few digits, the SRC test is inconclusive, but with 10 or more it
can give useful outcomes. In an early study, Norell and Novacek (1992) found that 75% of mammal
cladograms agreed significantly with the order of fossils. Those that failed the clade versus fossil
order SRC test were groups such as primates that are suspected to have a poor fossil record.
Other metrics for comparing cladograms with geological time and fossil occurrences are the
stratigraphic consistency index (SCI), the relative completeness index (RCI) and the gap excess ratio
(GER).
• The SCI (Huelsenbeck 1994) assesses how well the nodes in a cladogram correspond to the
known fossil record. Nodes are dated by the oldest known fossils of either sister group above
the node. Each node (Fig. 3.10a) is compared with the node immediately below it. If the upper
node is younger than, or equal in age to, the node below, the node is said to be stratigraphically
consistent. If the node below is younger, the upper node is stratigraphically inconsistent. The SCI
for a cladogram compares the ratio of the sums of stratigraphically consistent to inconsistent
nodes. SCI values can indicate cladograms whose nodes are all in line with stratigraphic expecta-
tions through to cladograms that imply a sequence of events that is entirely opposite to the known
fossil record.
• The RCI (Benton & Storrs 1994) takes account of the actual time spans between nodes, and of
implied gaps before the oldest known fossils of lineages. Sister groups, by defi nition, originated
from an immediate common ancestor, and diverged from that ancestor. Thus, both sister groups
should have fossil records that start at essentially the same time. In reality, usually the oldest
fossil of one lineage will be older than the oldest fossil of its sister lineage. The time gap between
these two oldest fossils is the ghost range or minimal cladistically-implied gap. The RCI (Fig.
3.10b) assesses the ratio of the ghost range to the known range, and high values imply that ghost
ranges are short, and hence that the fossil record is good.
• The GER (Wills 1999) is a modifi cation of the RCI that compares the actual proportion of ghost
range in a particular example with the minimum and maximum possible relative amount of ghost
range when the cladogram shape is modifi ed to maximize and minimize the ghost range (Fig. 3.10c,
d). This then places the result in the context of all possible results, and so assesses the congruence
of the tree with the fossil record, taking account of the particular cladogram shape.
These metrics can be used to assess the stratigraphic likelihood of competing cladistic hypotheses
that are otherwise equally likely – in other words, if one cladogram implies very little ghost range,
Continued