
Page 88 - Introduction to Paleobiology and The Fossil Record
P. 88
TAPHONOMY AND THE QUALITY OF THE FOSSIL RECORD 75
stones, depend on abundant shells and other
120 0.16
biological debris for their composition. There
is also a human factor – geologists tend to
100
Number of formations ( ) 80 0.08 Observed extinction rate per lineage (myr) ( ) dant than if they are absent. The fossils
name more formations where fossils are abun-
0.12
provide the basis for biostratigraphy and the
60
discrimination of rock units (see pp. 25–7).
On reflection, many paleontologists and
40
geologists prefer a third option, not that the
0.04
rocks control the fossils or the fossils control
20
the rocks, but that both are dependent on a
0
500 400 300 200 100 0 third driving factor. This has been termed the
Geological time (myr) common cause hypothesis by Peters (2005).
(a) The third driving factor is likely to relate to
(i) plate tectonic movements and long-term rises
1000 and falls in sea level: perhaps marine diversity
No. of families 500 is high at times of high sea level, and low at
times of low sea level. The common cause
hypothesis seems to be a better explanation
of the apparent correlation between the rock
(ii) and fossil records than the preservation bias
No. of families 1000 Foote 2002). It is hard to distinguish between
hypothesis (Raup 1972; Smith 2001; Peters &
600
the two views, but Peters (2008) shows that,
400 although there is a correlation between fossil
and rock records for a comprehensive marine
(iii)
Per cent flooding 60 Platform when it is partitioned into a major “Paleo-
fossil dataset, the agreement breaks down
50
zoic” and “modern” division.
Sea level
40
30
Times of crisis in the geological record may
20
flooding
Cam. Ord. S. Dev. Carb. Per. Tri. Jur. Cret. Tert. provide tests of the common cause and pres-
Pc Paleozoic Mesozoic Cen ervation bias hypotheses. Generally, as Peters
(b)
and Foote (2002) showed, the numbers of
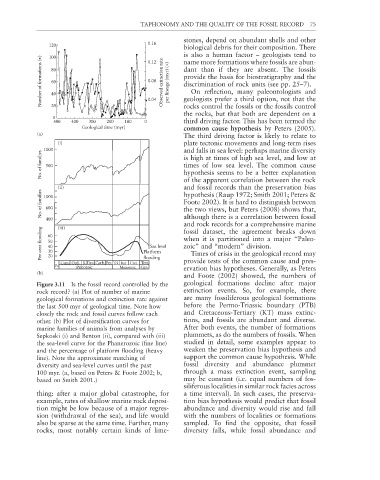
Figure 3.11 Is the fossil record controlled by the geological formations decline after major
rock record? (a) Plot of number of marine extinction events. So, for example, there
geological formations and extinction rate against are many fossiliferous geological formations
the last 500 myr of geological time. Note how before the Permo-Triassic boundary (PTB)
closely the rock and fossil curves follow each and Cretaceous-Tertiary (KT) mass extinc-
other. (b) Plot of diversifi cation curves for tions, and fossils are abundant and diverse.
marine families of animals from analyses by After both events, the number of formations
Sepkoski (i) and Benton (ii), compared with (iii) plummets, as do the numbers of fossils. When
the sea-level curve for the Phanerozoic (fi ne line) studied in detail, some examples appear to
and the percentage of platform fl ooding (heavy weaken the preservation bias hypothesis and
line). Note the approximate matching of support the common cause hypothesis. While
diversity and sea-level curves until the past fossil diversity and abundance plummet
100 myr. (a, based on Peters & Foote 2002; b, through a mass extinction event, sampling
based on Smith 2001.) may be constant (i.e. equal numbers of fos-
siliferous localities in similar rock facies across
thing: after a major global catastrophe, for a time interval). In such cases, the preserva-
example, rates of shallow marine rock deposi- tion bias hypothesis would predict that fossil
tion might be low because of a major regres- abundance and diversity would rise and fall
sion (withdrawal of the sea), and life would with the numbers of localities or formations
also be sparse at the same time. Further, many sampled. To find the opposite, that fossil
rocks, most notably certain kinds of lime- diversity falls, while fossil abundance and